'Am I missing bars in my chart?' two simple indicators to show you
This software component for MetaTrader 4 is built to enhance the capabilities of your trading environment. This technical indicator acts as a specialized analysis tool designed to visualize market data. It helps traders identify emerging trends, momentum shifts, and key support or resistance levels by plotting statistical calculations directly onto price charts.
How to Setup and Use 'Am I missing bars in my chart?' two simple indicators to show you
1. Installation: Place your file in the MQL/Indicators folder via "Open Data Folder" and restart your terminal.
2. Loading: Find the indicator in the Navigator, drag it onto your chart, and configure the input parameters in the popup window.
3. Customization: Press Ctrl+I to open the indicator list, select your tool, and click "Properties" to change colors, levels, or visual styles.
4. Updating: Replace the old file in the Indicators folder with the new version and restart the platform to apply changes.
Frequently Asked Questions
Q: Why is my indicator not showing? A: Verify the file is in the MQL/Indicators folder, or try right-clicking the "Indicators" tree in the Navigator and clicking "Refresh."
Q: Do custom indicators slow down the platform? A: Too many complex indicators can impact performance; remove unused ones via the "Indicator List" (Ctrl+I).
Q: Can I use MT4 indicators on MT5? A: No, MQL4 and MQL5 are distinct languages; ensure the indicator is compiled specifically for your platform version.
Description & Settings
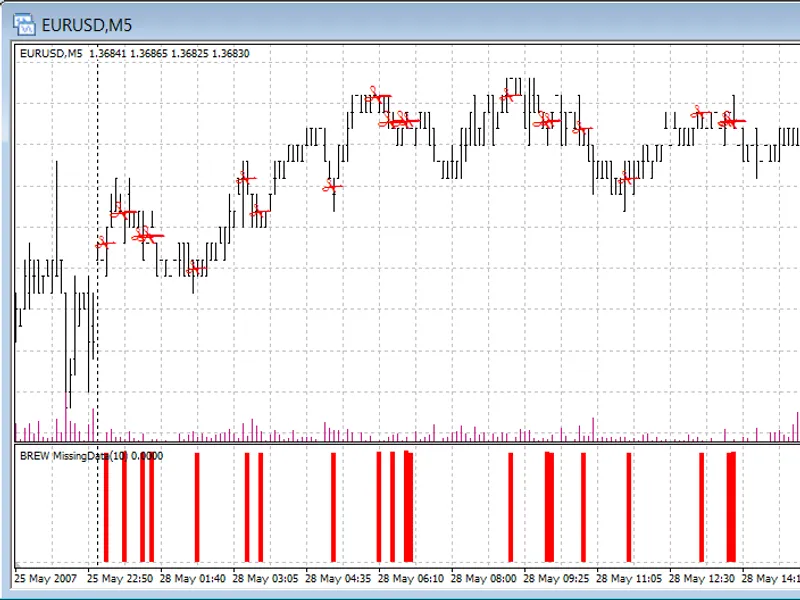
I wrote these to help me find visually where my data was patchy. It's wasn't intended for publication, so WYSIWYG!
I'm happy for people to use them for their own personal (or even company) use, but I would be annoyed if someone decided to sell them.
The logic takes weekends (49 hours) into account, but not public holidays. My broker use CET time (no Sunday bars) so unsure how it works with US times.
Note that the 'same chart' indicator has 5 size of scissors (bigger scissors = more missing data), and the separate chart has slightly higher bars as more data is missing.
Feel free to change logic if you wish!
Image: