Candle Sizes
This is a powerful addition to your MetaTrader 5 toolkit designed to optimize market analysis and performance. This technical indicator acts as a specialized analysis tool designed to visualize market data. It helps traders identify emerging trends, momentum shifts, and key support or resistance levels by plotting statistical calculations directly onto price charts.
How to Setup and Use Candle Sizes
1. Installation: Place your file in the MQL/Indicators folder via "Open Data Folder" and restart your terminal.
2. Loading: Find the indicator in the Navigator, drag it onto your chart, and configure the input parameters in the popup window.
3. Customization: Press Ctrl+I to open the indicator list, select your tool, and click "Properties" to change colors, levels, or visual styles.
4. Updating: Replace the old file in the Indicators folder with the new version and restart the platform to apply changes.
Frequently Asked Questions
Q: Why is my indicator not showing? A: Verify the file is in the MQL/Indicators folder, or try right-clicking the "Indicators" tree in the Navigator and clicking "Refresh."
Q: Do custom indicators slow down the platform? A: Too many complex indicators can impact performance; remove unused ones via the "Indicator List" (Ctrl+I).
Q: Can I use MT4 indicators on MT5? A: No, MQL4 and MQL5 are distinct languages; ensure the indicator is compiled specifically for your platform version.
Description & Settings
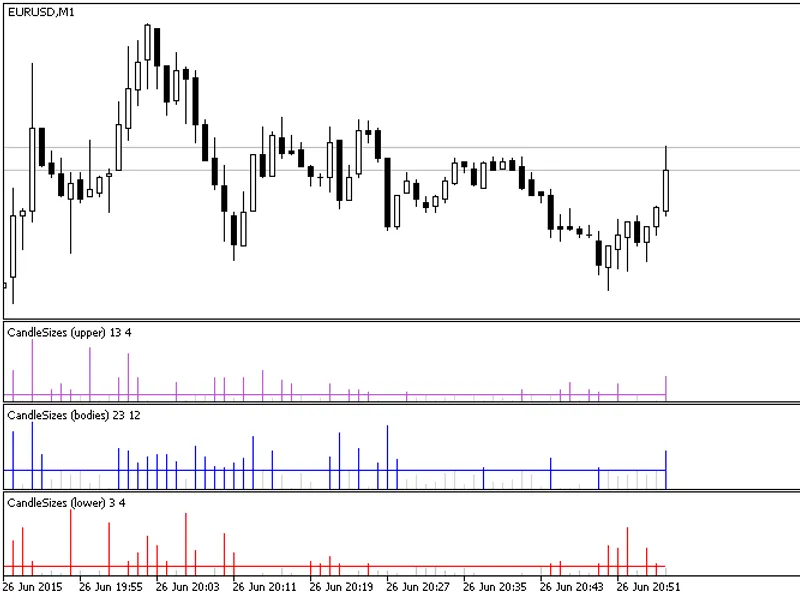
The indicator shows the size of candlestick elements. One histogram bar corresponds to a certain element size on a current candlestick, the histogram line indicates the daily average value of selected elements. A histogram bar changes its color to the color of the line if the element size exceeds the daily average.
Input Parameters:
inpType — display type (show the size of upper shadows, lower shadows or bodies);
inpClr — histogram color (if the element size exceeds the daily average);
inpNeutralClr — neutral color, if the element size doesn't exceed the daily average.
Tips:
Analyze the values of upper shadows after an uptrend movement, and the values of lower shadows — after a downtrend movement (trend reversal).
It can be used as a confirming signal to determine important price levels (instead of a candlestick patterns indicator).
It can be used as a basis for developing candlestick indicators.
The indicator can work on timeframes up to Н2.