MA C D Multi-color Histogram with Signal Line
This software component for MetaTrader 5 is built to enhance the capabilities of your trading environment. This technical indicator acts as a specialized analysis tool designed to visualize market data. It helps traders identify emerging trends, momentum shifts, and key support or resistance levels by plotting statistical calculations directly onto price charts.
How to Setup and Use MA C D Multi-color Histogram with Signal Line
1. Installation: Place your file in the MQL/Indicators folder via "Open Data Folder" and restart your terminal.
2. Loading: Find the indicator in the Navigator, drag it onto your chart, and configure the input parameters in the popup window.
3. Customization: Press Ctrl+I to open the indicator list, select your tool, and click "Properties" to change colors, levels, or visual styles.
4. Updating: Replace the old file in the Indicators folder with the new version and restart the platform to apply changes.
Frequently Asked Questions
Q: Why is my indicator not showing? A: Verify the file is in the MQL/Indicators folder, or try right-clicking the "Indicators" tree in the Navigator and clicking "Refresh."
Q: Do custom indicators slow down the platform? A: Too many complex indicators can impact performance; remove unused ones via the "Indicator List" (Ctrl+I).
Q: Can I use MT4 indicators on MT5? A: No, MQL4 and MQL5 are distinct languages; ensure the indicator is compiled specifically for your platform version.
Description & Settings
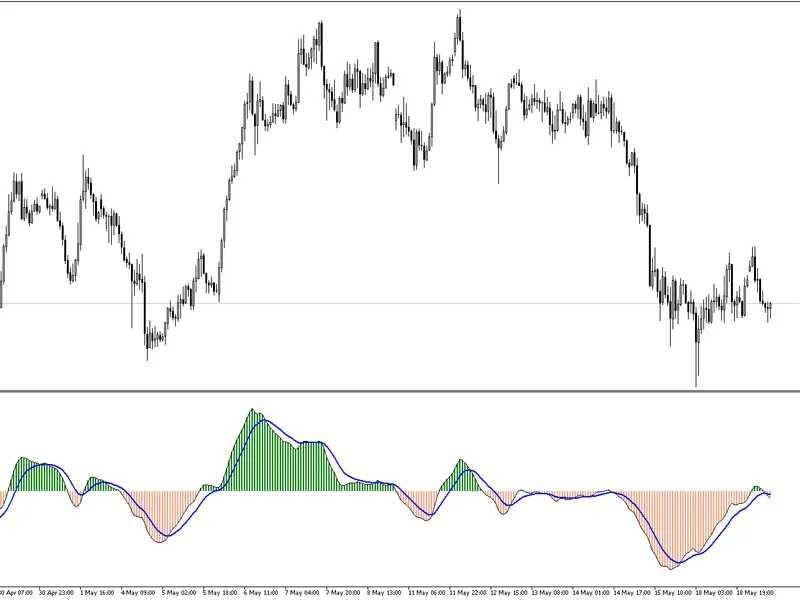
The histogram is designed to change color based on its position relative to the zero level: it turns
Green
when the MACD value is positive (bullish territory) and
Salmon
when it is negative (bearish territory). This allows traders to instantly identify the current market bias and zero-line crossovers.
Indicator components include:
Main MACD Line:
The difference between the Fast and Slow EMAs.
Signal Line:
A Moving Average of the MACD line.
Color Histogram:
A visual representation of the MACD line’s value with color alerts for trend direction.
Input parameters:
Fast EMA Period:
Period for the fast moving average (default: 12).
Slow EMA Period:
Period for the slow moving average (default: 26).
Signal MA Period:
Period for the signal line (default: 9).
Signal MA Method:
Choice of EMA, SMA, SMMA, or LWMA for the signal line.
Applied Price:
Price type used for calculations (default: Median Price).
Image:
Recommendations:
Zero-Line Crossover:
Use the histogram’s color change to identify potential shifts in long-term momentum (Green for bullish, Salmon for bearish).
Signal Line Crossover:
Look for the intersection of the Black (Main) and Blue (Signal) lines for entry or exit signals.
Divergence:
This indicator is excellent for spotting classical MACD divergences between price action and the MACD line/histogram.
Multi-Market Use:
The indicator works effectively across all timeframes and asset classes, including Forex, Stocks, Commodities, and Cryptocurrencies.
Confirmation:
Combine this indicator with price action or volume-based indicators for higher probability trade setups.