Figurelli RS I Auto
This software component for MetaTrader 4 is built to enhance the capabilities of your trading environment. This technical indicator acts as a specialized analysis tool designed to visualize market data. It helps traders identify emerging trends, momentum shifts, and key support or resistance levels by plotting statistical calculations directly onto price charts.
How to Setup and Use Figurelli RS I Auto
1. Installation: Place your file in the MQL/Indicators folder via "Open Data Folder" and restart your terminal.
2. Loading: Find the indicator in the Navigator, drag it onto your chart, and configure the input parameters in the popup window.
3. Customization: Press Ctrl+I to open the indicator list, select your tool, and click "Properties" to change colors, levels, or visual styles.
4. Updating: Replace the old file in the Indicators folder with the new version and restart the platform to apply changes.
Frequently Asked Questions
Q: Why is my indicator not showing? A: Verify the file is in the MQL/Indicators folder, or try right-clicking the "Indicators" tree in the Navigator and clicking "Refresh."
Q: Do custom indicators slow down the platform? A: Too many complex indicators can impact performance; remove unused ones via the "Indicator List" (Ctrl+I).
Q: Can I use MT4 indicators on MT5? A: No, MQL4 and MQL5 are distinct languages; ensure the indicator is compiled specifically for your platform version.
Description & Settings
The indicator figures out the gain value based in minimal and maximal values inside the sample and period programmed.
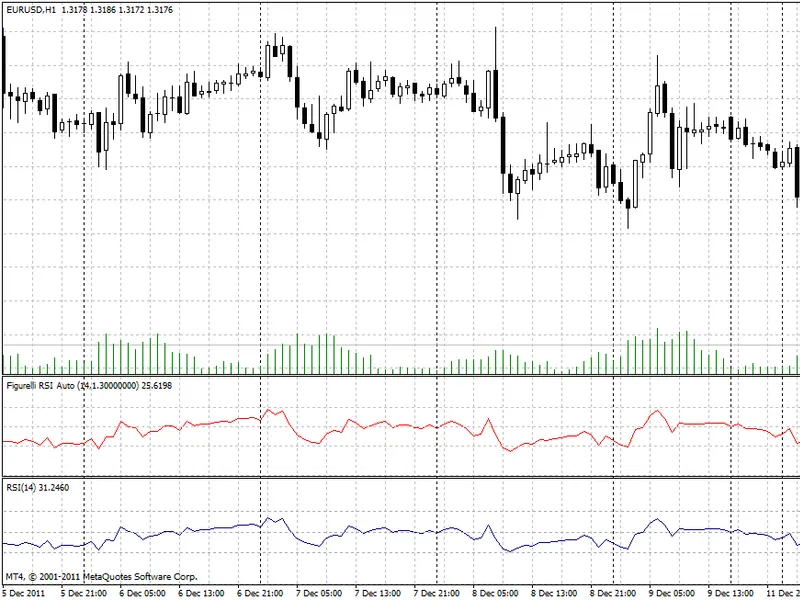
Below two pictures for better understand the adjustment and the indicator using period 14 and period 30. Original Welles Wilder RSI (blue) is compared with Figurelli RSI (red) using the same periods.
Image 1: example for period 14
For period 14, the automatic adjustment for gain parameter was 1.4 (for EUR/USD H1). Note that Figurelli RSI (red) automatic gain adjustment indicates small differences in 30 or 70 reach points, so the gain is relevant even in smal periods.
Image 2: example for period 300
For period 300, the automatic adjustment for gain parameter was 6.7 (for EUR/USD H1). Note that Welles Wilder RSI (blue) will never reach levels 30 or 70 in long periods, compared with Figurelli RSI (red) using the same periods.
Note that the indicator name has the Period and Gain values. For example, Figurelli RSI Auto (300, 6.7) indicates period 300 and gain 6.7 for picture above.