Signal Direction Probability
This software component for MetaTrader 4 is built to enhance the capabilities of your trading environment. This technical indicator acts as a specialized analysis tool designed to visualize market data. It helps traders identify emerging trends, momentum shifts, and key support or resistance levels by plotting statistical calculations directly onto price charts.
How to Setup and Use Signal Direction Probability
1. Installation: Place your file in the MQL/Indicators folder via "Open Data Folder" and restart your terminal.
2. Loading: Find the indicator in the Navigator, drag it onto your chart, and configure the input parameters in the popup window.
3. Customization: Press Ctrl+I to open the indicator list, select your tool, and click "Properties" to change colors, levels, or visual styles.
4. Updating: Replace the old file in the Indicators folder with the new version and restart the platform to apply changes.
Frequently Asked Questions
Q: Why is my indicator not showing? A: Verify the file is in the MQL/Indicators folder, or try right-clicking the "Indicators" tree in the Navigator and clicking "Refresh."
Q: Do custom indicators slow down the platform? A: Too many complex indicators can impact performance; remove unused ones via the "Indicator List" (Ctrl+I).
Q: Can I use MT4 indicators on MT5? A: No, MQL4 and MQL5 are distinct languages; ensure the indicator is compiled specifically for your platform version.
Description & Settings
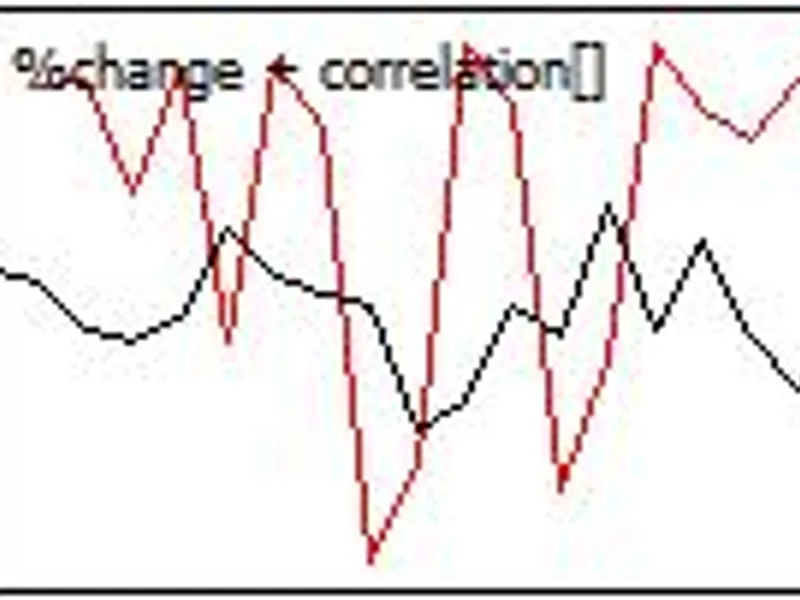
This indicator determines the percent change between previous closing prices, for the lenght of the array, and draws the percent change signal in the indicator window. After the percent change is determined, correlation between the price signal, and percent change is calcualated and drawn(red line is the correlation and black line is percent change).
In theory, if there is high correlation(greater than 0.7) between percent change and price signal, then the price signal should continue in the same direction. For example, if a price signal is moving upward, and the correlation(red line) between the price signal and price percent change is high, then the price should continue to keep moving in the same direction, which generates a buy signal. A sell signal is generated, if the correlation between the price signal and the percent change is high and the price signal is moving downward.
Note: for the correlation(red line) to appear, the indicator needs to have at least two ticks. First tick, calculates percent change, the second tick, calculates correlation between price change and price signal.
Image: