Session Daylight Gradient — Ambient Forex Session Overlay
This tool for MetaTrader 5 is specifically engineered to streamline your trading operations. This technical indicator acts as a specialized analysis tool designed to visualize market data. It helps traders identify emerging trends, momentum shifts, and key support or resistance levels by plotting statistical calculations directly onto price charts.
How to Setup and Use Session Daylight Gradient — Ambient Forex Session Overlay
1. Installation: Place your file in the MQL/Indicators folder via "Open Data Folder" and restart your terminal.
2. Loading: Find the indicator in the Navigator, drag it onto your chart, and configure the input parameters in the popup window.
3. Customization: Press Ctrl+I to open the indicator list, select your tool, and click "Properties" to change colors, levels, or visual styles.
4. Updating: Replace the old file in the Indicators folder with the new version and restart the platform to apply changes.
Frequently Asked Questions
Q: Why is my indicator not showing? A: Verify the file is in the MQL/Indicators folder, or try right-clicking the "Indicators" tree in the Navigator and clicking "Refresh."
Q: Do custom indicators slow down the platform? A: Too many complex indicators can impact performance; remove unused ones via the "Indicator List" (Ctrl+I).
Q: Can I use MT4 indicators on MT5? A: No, MQL4 and MQL5 are distinct languages; ensure the indicator is compiled specifically for your platform version.
Description & Settings
Session Daylight Gradient
is an ambient session awareness indicator for MetaTrader 5.Instead of drawing heavy session boxes, it uses a
soft background gradient
that visually communicates the current market regime—quiet hours, rising activity, peak volatility, and fade-out—at a glance.
This helps traders stay aligned with typical session behavior without cluttering the chart.
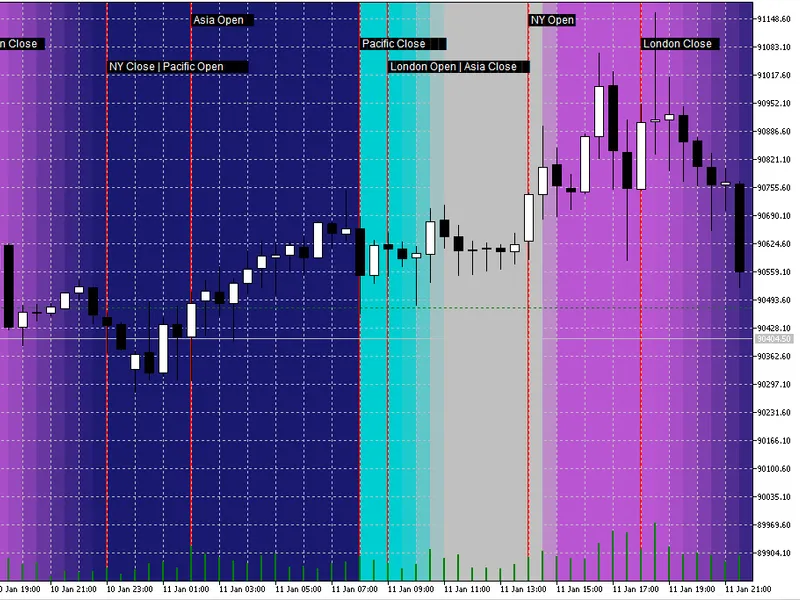
What You See on the Chart
Session Daylight Background:
A colored gradient that changes smoothly through the trading day:
Pacific (quiet / reset)
Asia (range / consolidation)
London (activity increase)
London/NY overlap (peak volatility)
NY fade-out into Pacific
Session Event Markers (optional):
Vertical separator lines and compact labels for key events such as:
Asia Open / Asia Close
London Open / London Session
NY Open (overlap start)
London Close
NY Close / Pacific Open
Sunrays (optional):
Add highlighted time windows for scheduled events (e.g., economic news).You can enter multiple times in a simple list, and each is drawn as a “sunray” band around the timestamp.
Why It’s Useful
Most session indicators show boxes that dominate the chart. This indicator focuses on
low-noise, high-information visuals
:
You
instantly sense
whether you are in a calmer session or a high-volatility window.
The background is
subtle
(opacity adjustable), so price action remains the priority.
Event markers give structure without forcing you to read a timetable every day.
Timezone Handling (Important)
Markets trade globally, but brokers and PCs can use different time references.This indicator provides three modes:
UTC
— Recommended for consistent global session definitions.
Broker/Server Time
— Uses your broker’s server time (chart time).
PC Local Time
— Uses your computer’s local time.
Additionally, you can apply a
Manual DST Shift (hours)
to correct cases where daylight saving time causes session alignment to appear off by one hour.
Main Inputs General Settings
EnableGradient — Enable/disable the background gradient.
EnableSunrays — Enable/disable news highlight bands.
SessionTimeMode — Choose UTC / Broker-Server / PC Local.
ManualDSTShiftHours — Manually shift session reference by hours (+1 / -1 / 0).
Session Times (HH:MM)
Customize session windows using simple strings:
AsiaStart / AsiaEnd
LondonOpenStart / LondonOpenEnd
OverlapStart / OverlapEnd
NYCloseStart / NYCloseEnd
PacificStart / PacificEnd (wraps midnight by design)
Colors & Intensity
PacificColor , AsiaColor , LondonColor , NYColor
MaxOpacity — Controls how subtle the background is (0–255).
SmoothingStrength — Smooth transition strength.
Visual Separators
ShowSessionLines
SessionLineColor , SessionLineStyle , SessionLineWidth
Sunrays
SunrayTimes — Example: 14:30; 16:00 or 2026-01-11 14:30; 16:00
SunrayWidthMinutes , SunrayOpacity , SunrayColor
Performance Notes
The indicator draws chart objects (rectangles/lines/text) only for the
visible range plus a buffer
.If you use very low timeframes with a large visible history, consider reducing visible bars or disabling some visual features for maximum responsiveness.
Typical Workflow
Attach the indicator to any chart.
Set SessionTimeMode to
UTC
(recommended).
If sessions appear shifted, adjust ManualDSTShiftHours .
Enable ShowSessionLines for clearer structure.
Add SunrayTimes if you want news/event highlights.