fair value gap/imbalance
This tool for MetaTrader 4 is specifically engineered to streamline your trading operations. This technical indicator acts as a specialized analysis tool designed to visualize market data. It helps traders identify emerging trends, momentum shifts, and key support or resistance levels by plotting statistical calculations directly onto price charts.
How to Setup and Use fair value gap/imbalance
1. Installation: Place your file in the MQL/Indicators folder via "Open Data Folder" and restart your terminal.
2. Loading: Find the indicator in the Navigator, drag it onto your chart, and configure the input parameters in the popup window.
3. Customization: Press Ctrl+I to open the indicator list, select your tool, and click "Properties" to change colors, levels, or visual styles.
4. Updating: Replace the old file in the Indicators folder with the new version and restart the platform to apply changes.
Frequently Asked Questions
Q: Why is my indicator not showing? A: Verify the file is in the MQL/Indicators folder, or try right-clicking the "Indicators" tree in the Navigator and clicking "Refresh."
Q: Do custom indicators slow down the platform? A: Too many complex indicators can impact performance; remove unused ones via the "Indicator List" (Ctrl+I).
Q: Can I use MT4 indicators on MT5? A: No, MQL4 and MQL5 are distinct languages; ensure the indicator is compiled specifically for your platform version.
Description & Settings
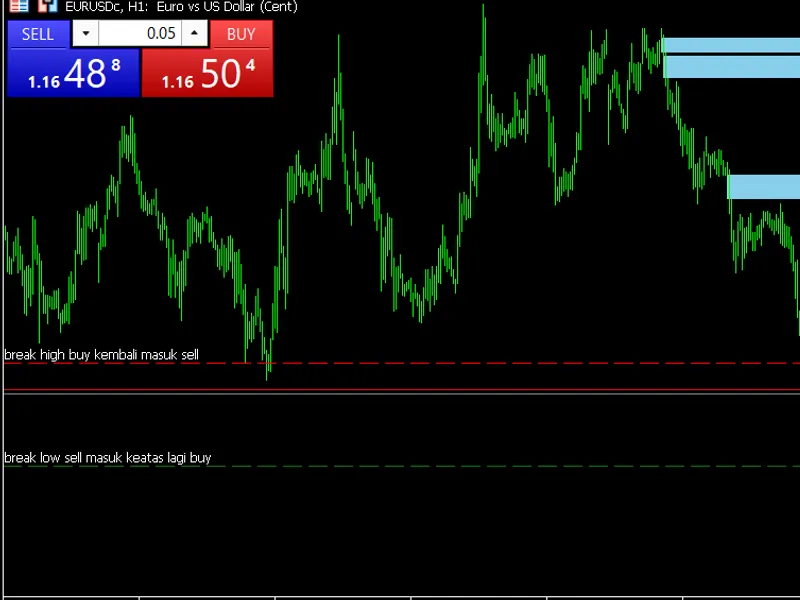
Dynamic Fair Value Gap (FVG) Indicator for MetaTrader 4
The Dynamic Fair Value Gap (FVG) indicator is a custom MQL5 technical analysis tool specifically designed to detect unmitigated (untouched) market price imbalances. This indicator is perfectly suited for traders utilizing *Smart Money Concepts (SMC)* or *Price Action* trading styles. Core Features and Functions 1. Unmitigated FVG Detection (Bullish & Bearish) - Automatically detects emerging FVGs (a 3-candle pattern) and highlights the *gap* area where price has moved too rapidly without opposing liquidity. - Bullish FVG : A gap formed between the High of Candle 1 and the Low of Candle 3. - Bearish FVG : A gap formed between the Low of Candle 1 and the High of Candle 3. 2. Auto-Removal of Mitigated FVGs - If an FVG area is touched (mitigated) by subsequent price action, the indicator automatically deletes the corresponding FVG rectangle and label from the chart. - This ensures your chart remains clean, displaying only "fresh" and relevant FVG zones to be used as *Entry* or *Target* areas. 3. Dynamic Forward Extension - As long as the FVG zone remains untouched by price, the rectangle and text label dynamically extend forward in time (protruding ahead of the current price by a customizable length, default is 18 bars). 4. Previous Daily High & Low Markers - The indicator provides crucial liquidity reference levels from the previous trading day (Previous Daily High & Low) by drawing automatic horizontal lines: - Yesterday's High Line (Red) : Labeled with *"break high buy kembali masuk sell"*. - Yesterday's Low Line (Green/Blue) : Labeled with *"break low sell masuk keatas lagi buy"*. - These horizontal lines are automatically deleted and refreshed to the new levels whenever the trading day changes. 5. Alerts & Notifications - Fully integrated with MT5 notification systems (Pop-up Alert, Sound, and Push Notifications) to notify you immediately when a new FVG pattern is formed. Key Input Variables - `BarsToKeep` (Default: 300) : Determines how far back (number of candles) the indicator will scan historical price data to look for FVGs. - `ForwardBars` (Default: 18) : Sets the visual extension length of the FVG rectangles into the future (ahead of the current candle) for easy monitoring. - `RectangleFill` (Default: true) : Determines whether the FVG rectangles will be filled with solid color or just drawn as outlines. How to Use Simply attach this indicator to your chart on any timeframe. It will immediately present unfilled FVG zones which frequently act as price "magnets." Furthermore, you can combine these FVG levels with price manipulation strategies based on the *Support/Resistance* lines derived from the previous day's highest and lowest prices.