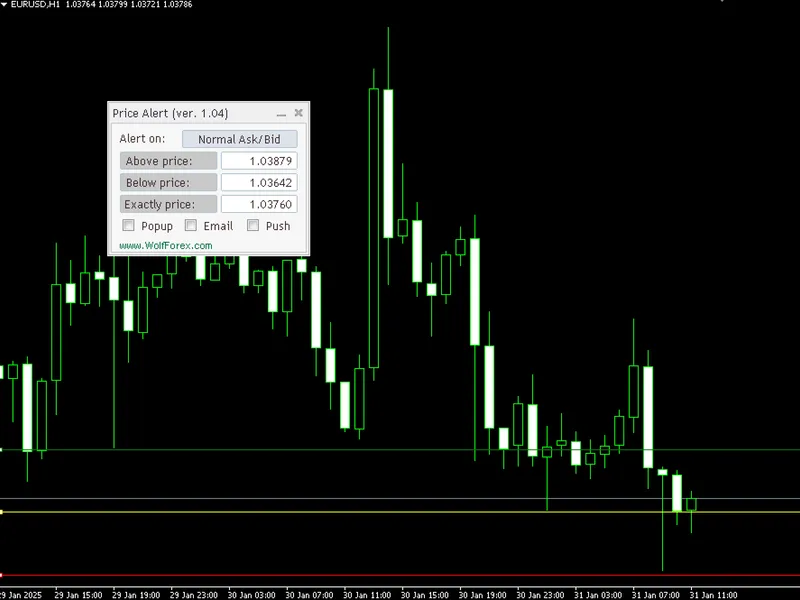
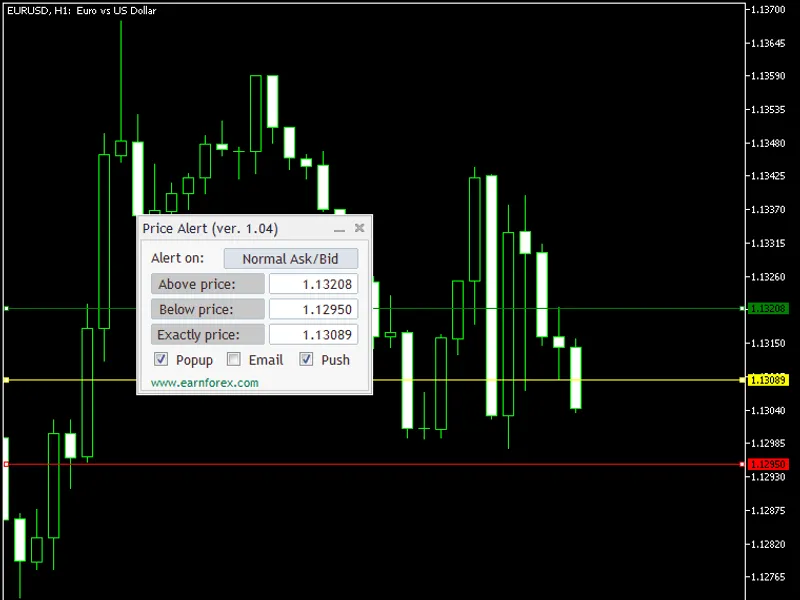
the indicator is equipped with a control panel that lets you quickly set alert price, levels, and types.input parameters main pricegoesabove(default = 0.0) — if price goes above th...
the indicator is equipped with a control panel that lets you quickly set alert price, levels, and types.input parameters main pricegoesabove(default = 0.0) — if price goes above th...
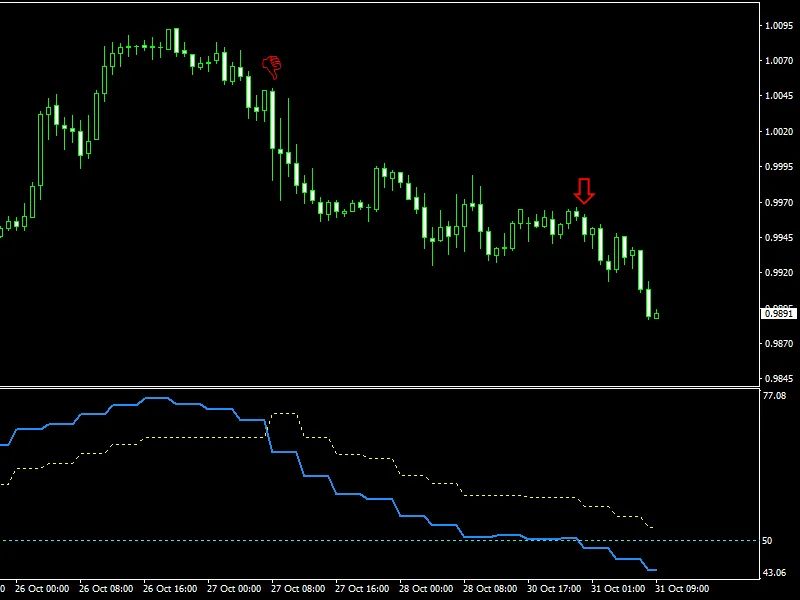
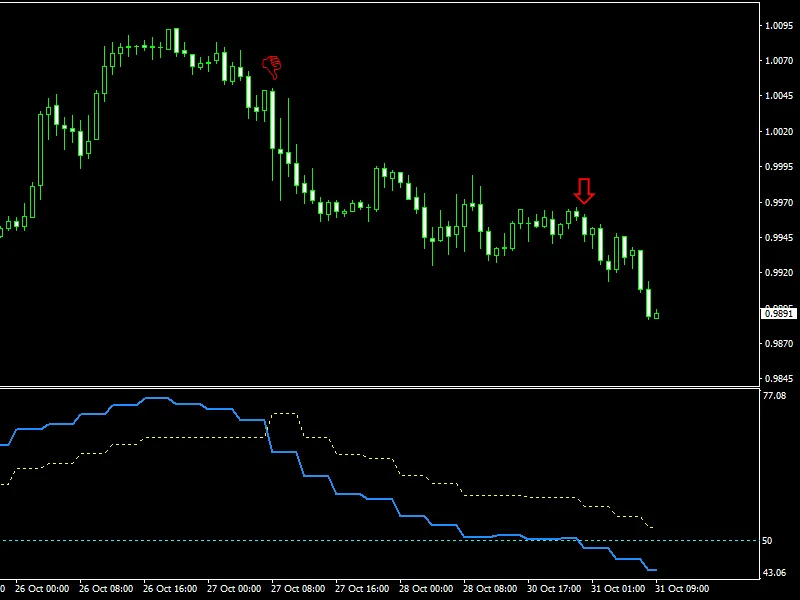
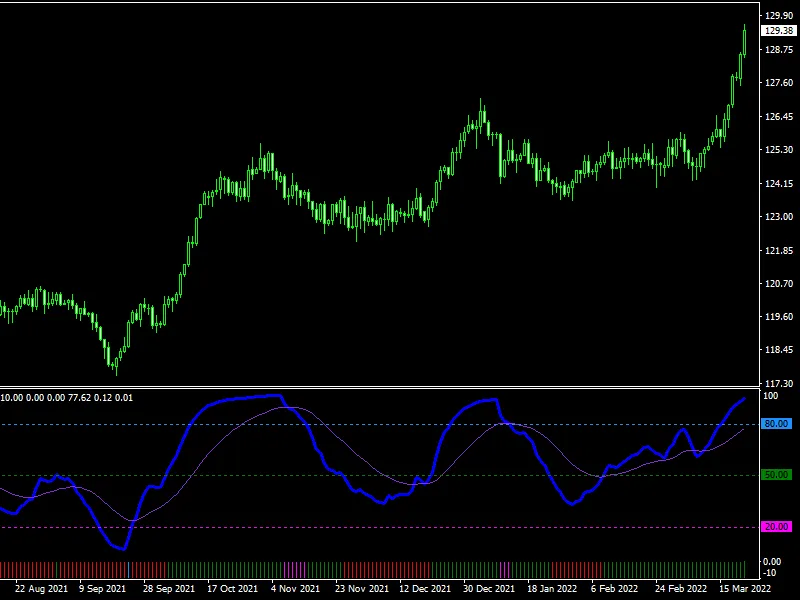
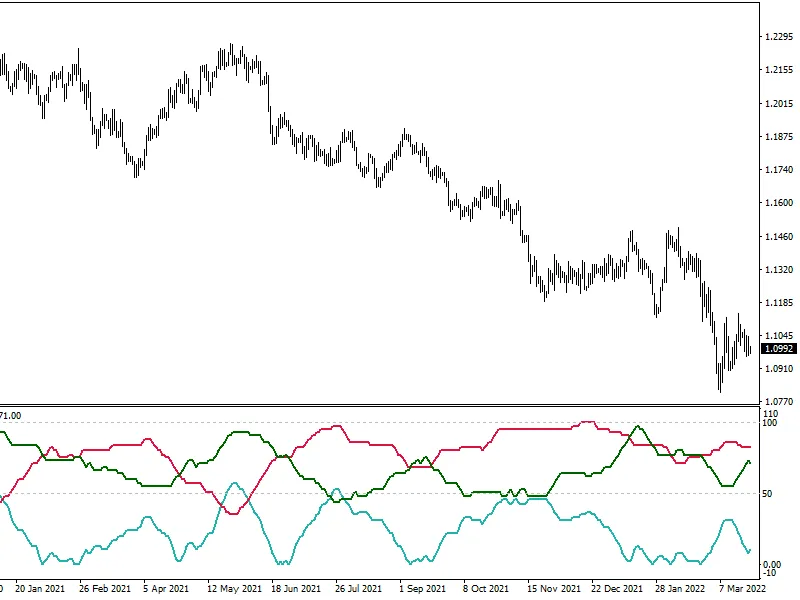
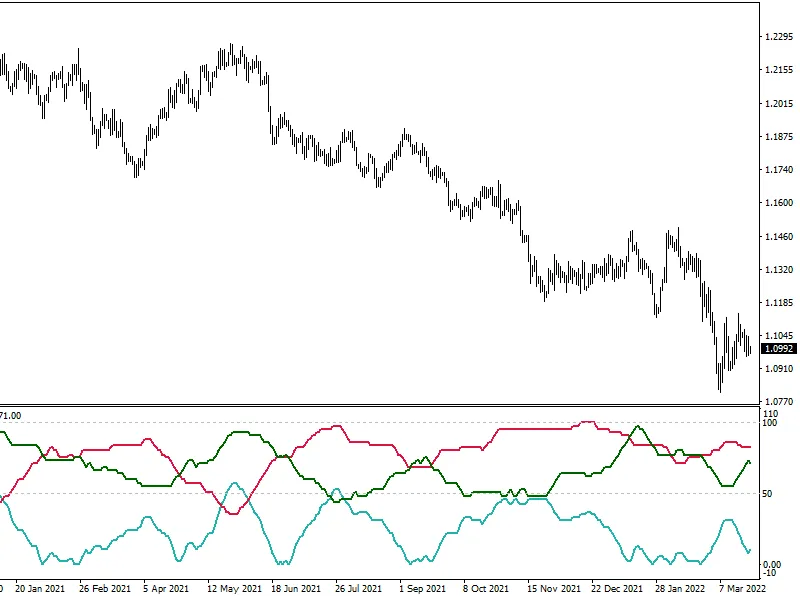
qqe metatrader indicator— or quantitative qualitative estimation, is based on a rather complex calculation of the smoothed rsi indicators. as a result, you get two lines in a separ...
qqe metatrader indicator— or quantitative qualitative estimation, is based on a rather complex calculation of the smoothed rsi indicators. as a result, you get two lines in a separ...
input parameters ma_type (default = mode_ema) — the type of rainbow moving average. ma_price (default = price_close) — the price type to use in the ma calculations. ma_period_nn (d...
input parameters ma_type (default = mode_ema) — the type of rainbow moving average. ma_price (default = price_close) — the price type to use in the ma calculations. ma_period_nn (d...
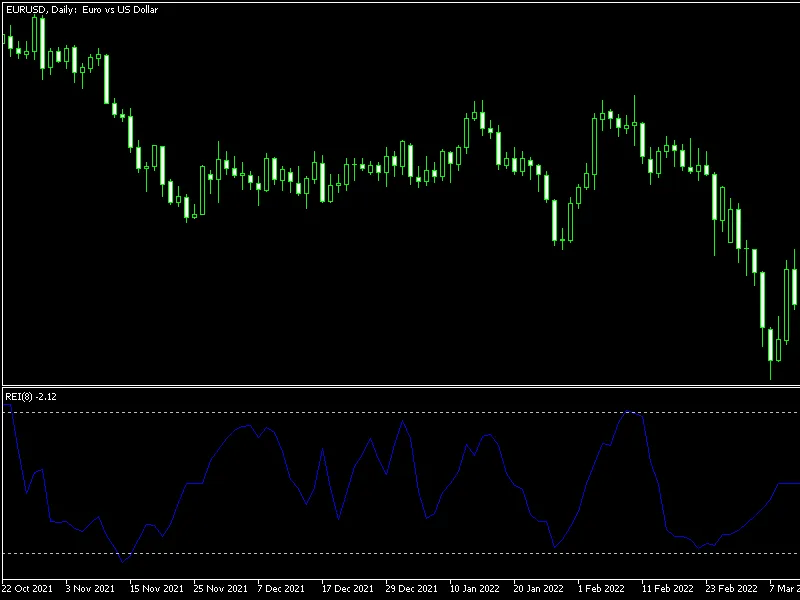
range expansion index (metatrader indicator)— is a relative oscillator indicator that measures the pace of the price changes and signals overbought/oversold states if the price dem...
range expansion index (metatrader indicator)— is a relative oscillator indicator that measures the pace of the price changes and signals overbought/oversold states if the price dem...
input parameters n(default = 20) — period value for the recent high/low levels.enablenativealerts(default = false) — if true, a native metatrader popup alert will be used when pric...
input parameters n(default = 20) — period value for the recent high/low levels.enablenativealerts(default = false) — if true, a native metatrader popup alert will be used when pric...
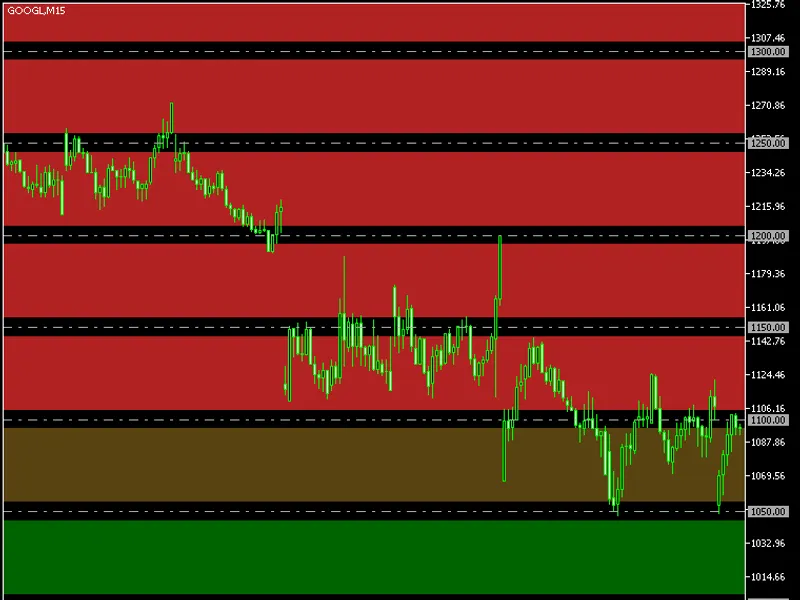
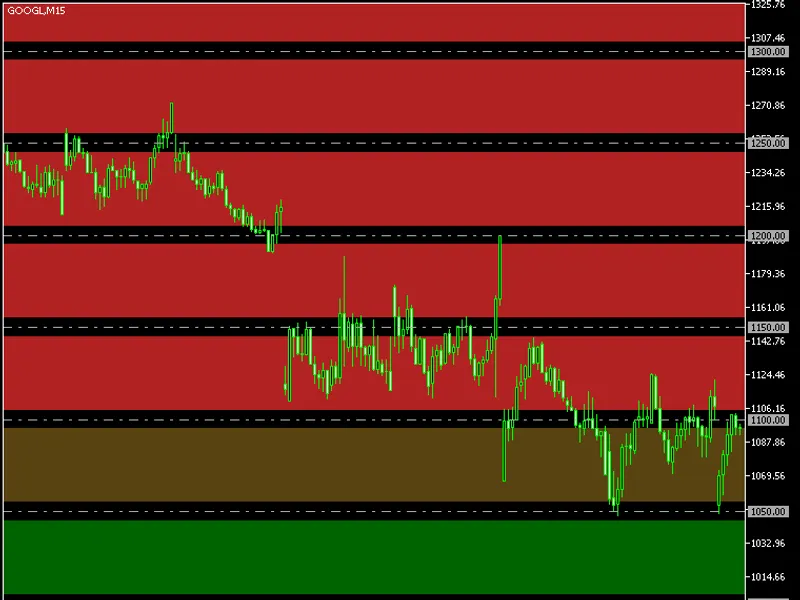
round levels metatrader indicator— an mt4/mt5 indicator that can display round levels and zones near them based on your configuration. it can be useful to trade off the natural psy...
round levels metatrader indicator— an mt4/mt5 indicator that can display round levels and zones near them based on your configuration. it can be useful to trade off the natural psy...
input parameters rsioma period(default = 14) — the period of the rsi and the moving averages that are used to calculate the rsi. increase it for smoothness, decrease it for signal ...
input parameters rsioma period(default = 14) — the period of the rsi and the moving averages that are used to calculate the rsi. increase it for smoothness, decrease it for signal ...
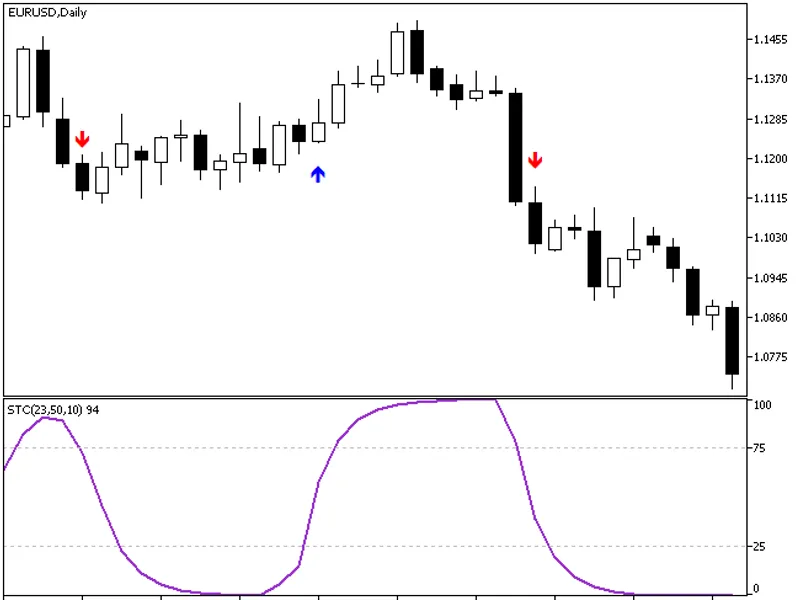
input parameters main mashort(default = 23) — the period of the fast moving average for the macd line calculation. should be less than malong.malong(default = 50) — the period of t...
input parameters main mashort(default = 23) — the period of the fast moving average for the macd line calculation. should be less than malong.malong(default = 50) — the period of t...
spread metatrader indicator— displays current spread in the main window of the chart. you can modify the font parameters, indicator's position and the normalization of the spread v...
spread metatrader indicator— displays current spread in the main window of the chart. you can modify the font parameters, indicator's position and the normalization of the spread v...
input parameters enablenativealerts(default = false) — if true, a native metatrader popup alert will be used when price closes above or below the support or resistance level.trigge...
input parameters enablenativealerts(default = false) — if true, a native metatrader popup alert will be used when price closes above or below the support or resistance level.trigge...
input parameters roc1period(default = 14) — the period of the first rate of change in the sum.roc2period(default = 11) — the period of the second rate of change in the sum.maperiod...
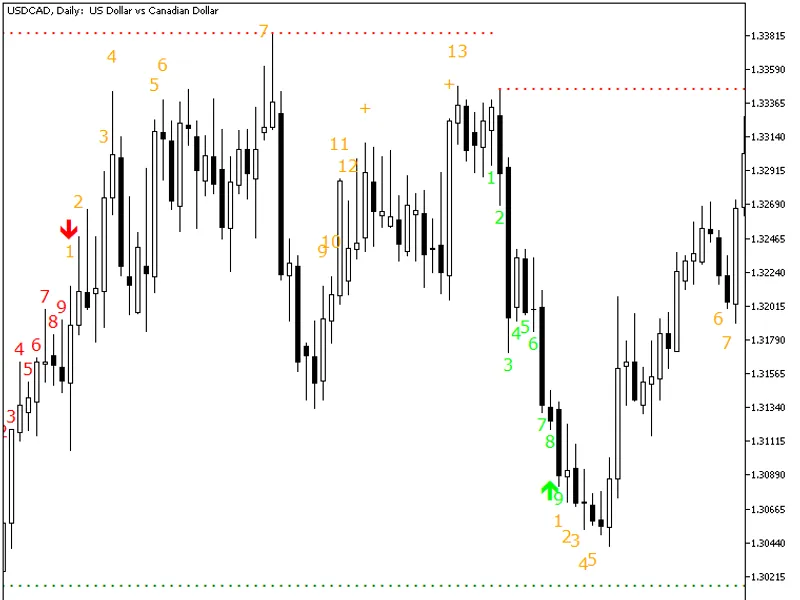
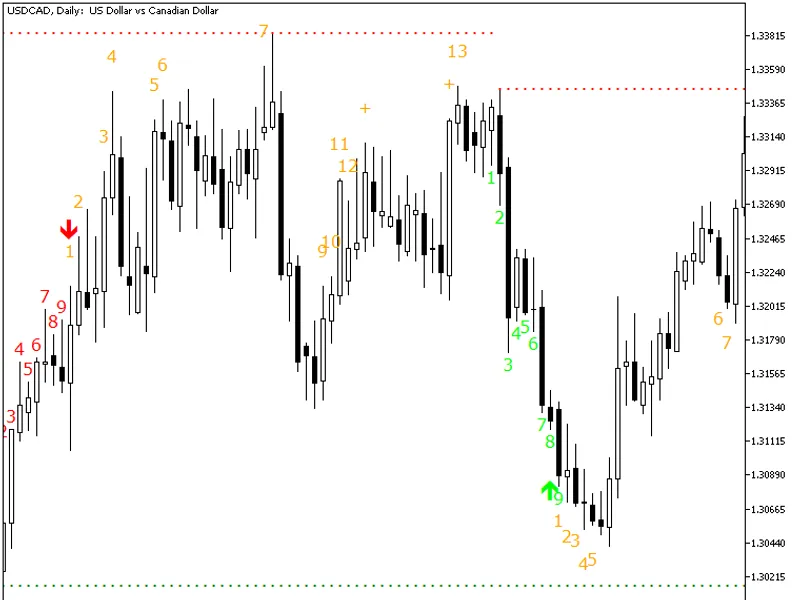
td sequential ultimate metatrader indicatorshows all parts of the td sequential method developed by the legendary technical analyst, tom demark. td sequential ultimate displays buy...
td sequential ultimate metatrader indicatorshows all parts of the td sequential method developed by the legendary technical analyst, tom demark. td sequential ultimate displays buy...
input parameters lookback period(default = 45) — the main period of the indicator. determines the amount of bars to look back to count the bear/bull-dominated ones.power period(def...
input parameters lookback period(default = 45) — the main period of the indicator. determines the amount of bars to look back to count the bear/bull-dominated ones.power period(def...
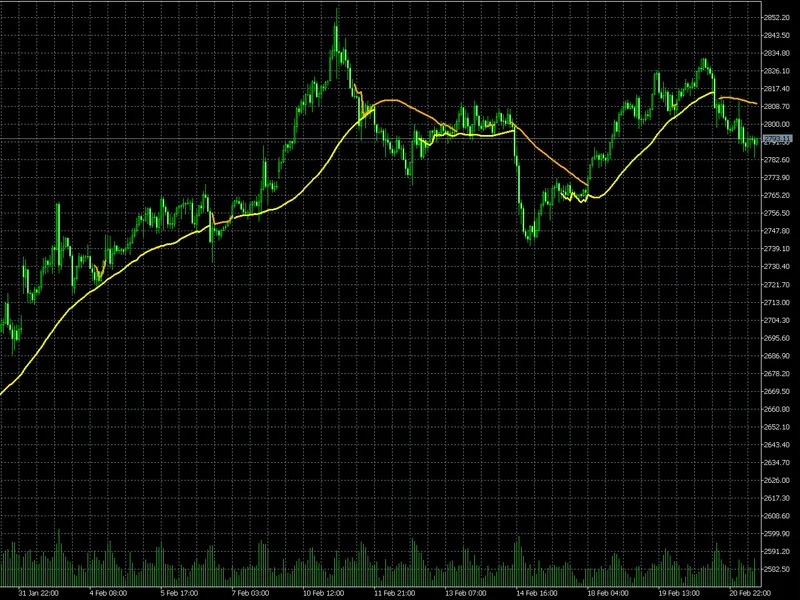
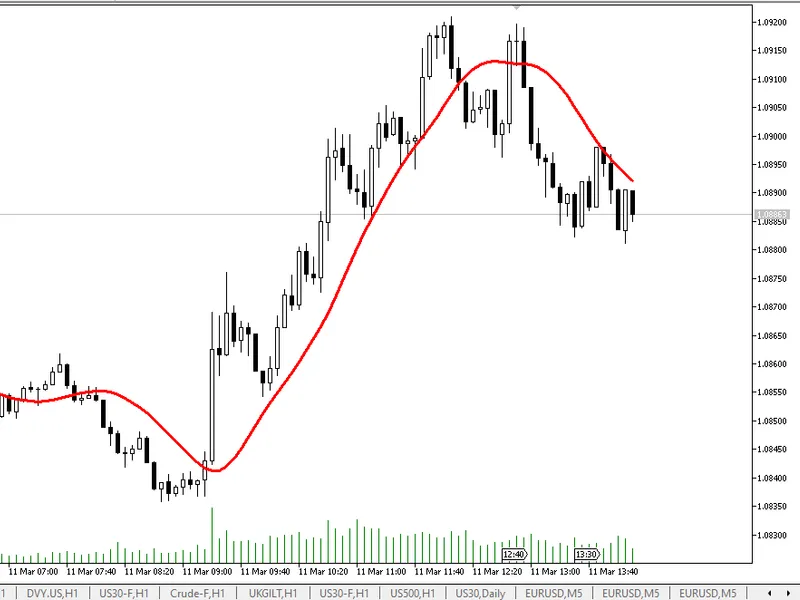
this is simply an indicator that professionally instantiates a moving average, and makes the code very portable so that it can be copied and pasted into bigger indicator projects.t...
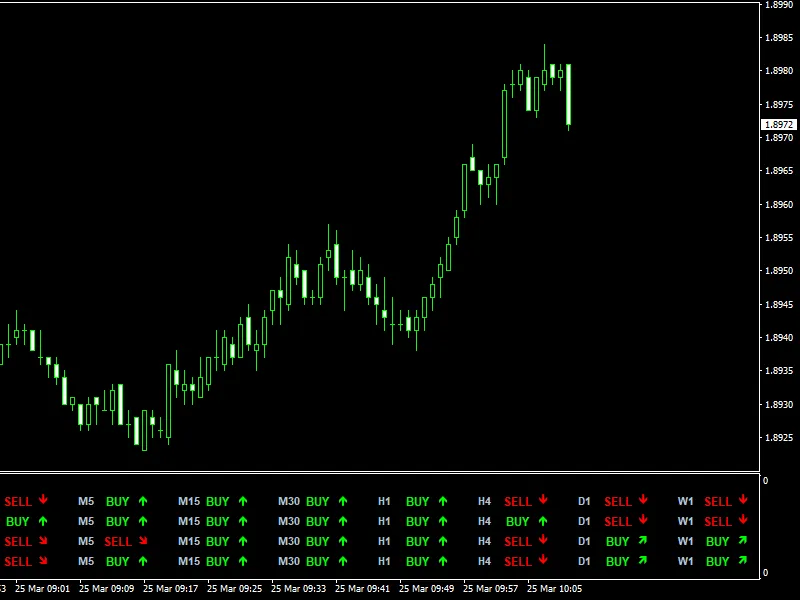
trade assistant metatrader indicator— a multi-timeframe indicator that is based on three standard indicators: stochastic oscillator, rsi (relative strength index), and cci (commodi...
trade assistant metatrader indicator— a multi-timeframe indicator that is based on three standard indicators: stochastic oscillator, rsi (relative strength index), and cci (commodi...
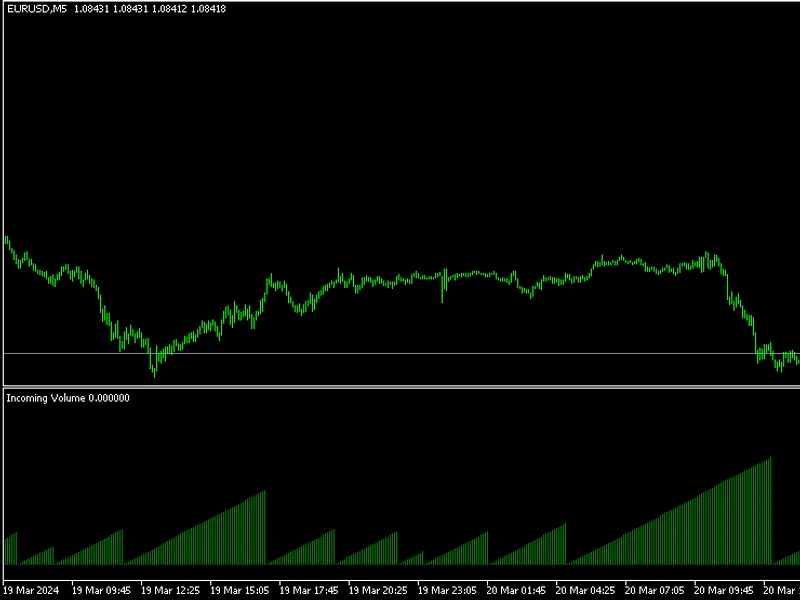
it's possible to plot incoming volume rather than simply plotting a single volume histogram bar to describe volume in the bar.instead of just showing total volume per bar like a st...
the algorithm at every bar the indicator checks all sma periods ranging from min_period to max_period to find which one caused the most recent bounce(either up or down). if nothing...
time to close mt5 timetoclose-v1.01is a chart indicator that displays real-time countdown to candle close with adaptive visual integration. i tried to make it simple, then polish i...
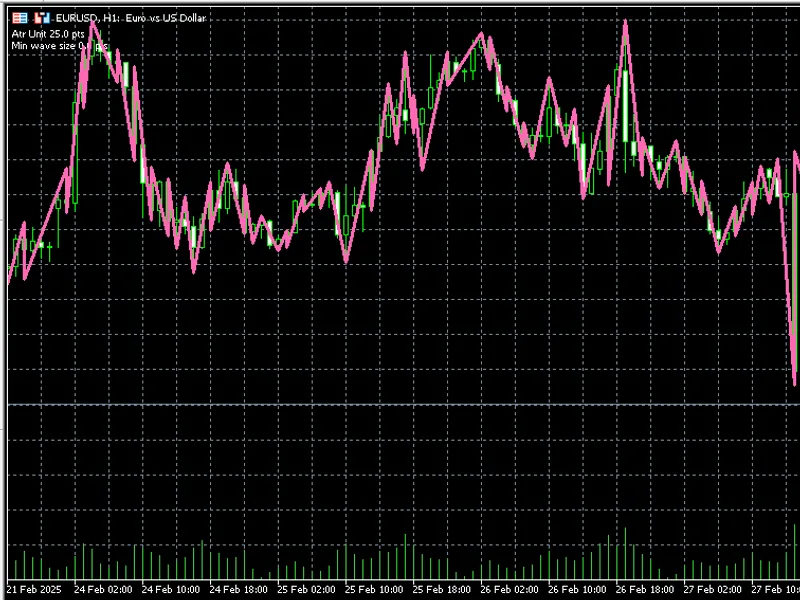
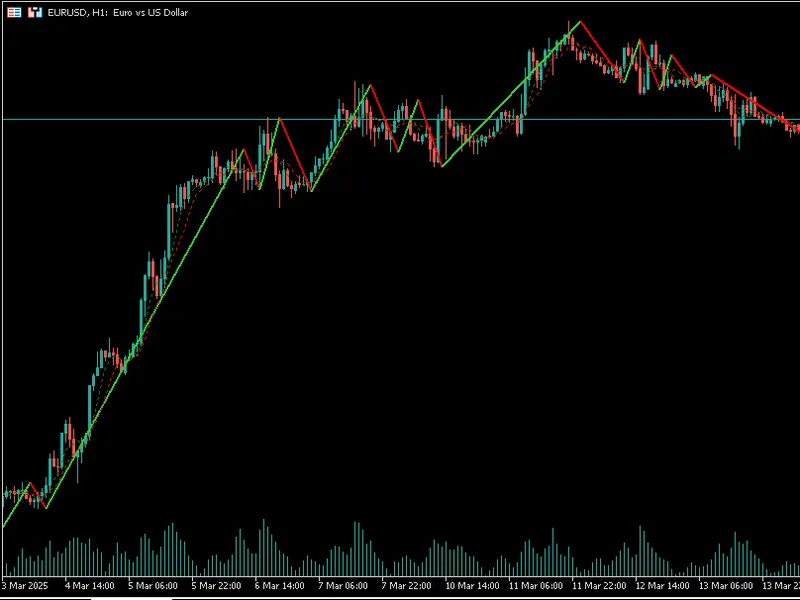
a zigzag which identifies new swing points based on a step size. the sensitivity of the swing detection is controlled by a single input "scale," which adjusts how responsive the in...
the setup we will need :1 zigzag plot 2 data buffers for the highs and the lows input parameters an ongoing set of system variables which reset whenever the indicator recalculates ...
the t3 indicator is an advanced moving average developed by tim tillson that reduces lag while maintaining a smooth curve that filters market noise. unlike traditional moving avera...
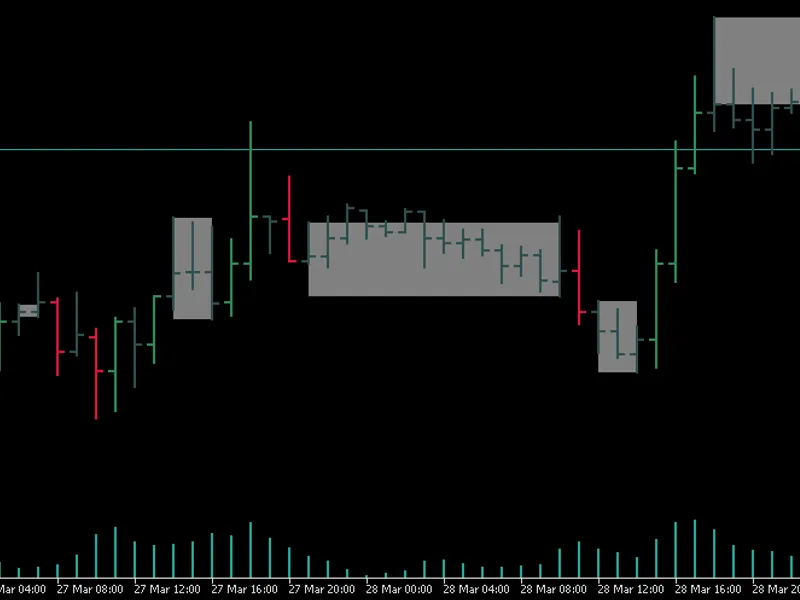
this indicator displays a subwindow with histogram of custom bars' durations in minutes. it's applicable for renko boxes, pnf, equivolume bars, and other custom charts, where bar d...
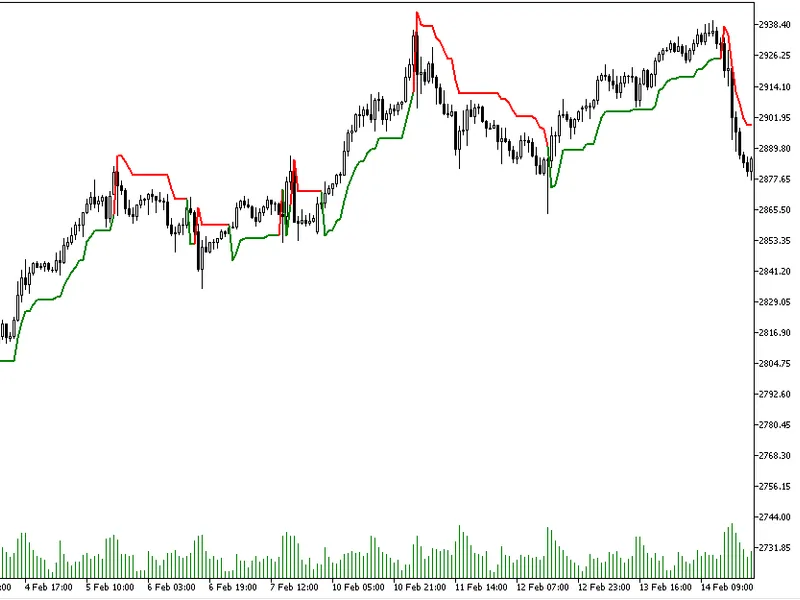
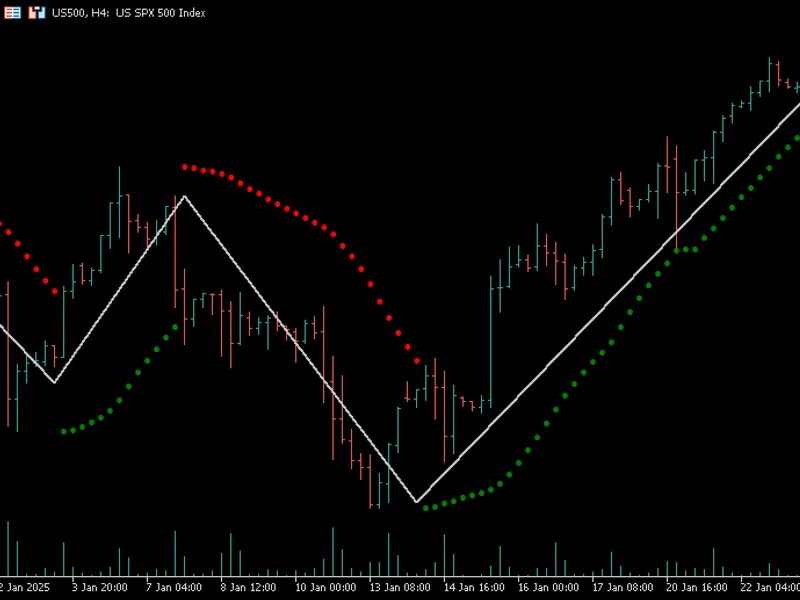
this supertrend indicator helps identify market trends based on average true range (atr) volatility. released under mit license for free and open-source use.core formula upper ban...
this is a static zigzag which connects the intersections of two moving average crossovers. it is another way to analyse moving averages.when the fast period moving average crosses ...
the green line represents the total amount of fvgs in uptrend (filled or unfilled) in the specified window_size. the red line represents the total amount of fvgs in downtrend (fil...
this is an effort to build an indicator that highlights a ranging market period with a standard object that uses a dynamic anchor point. the detection is non lagging, and has two m...
this indicator differs from the traditional zigzag you're already familiar with. the traditional zigzag serves a different purpose: it primarily highlights previous market swings a...
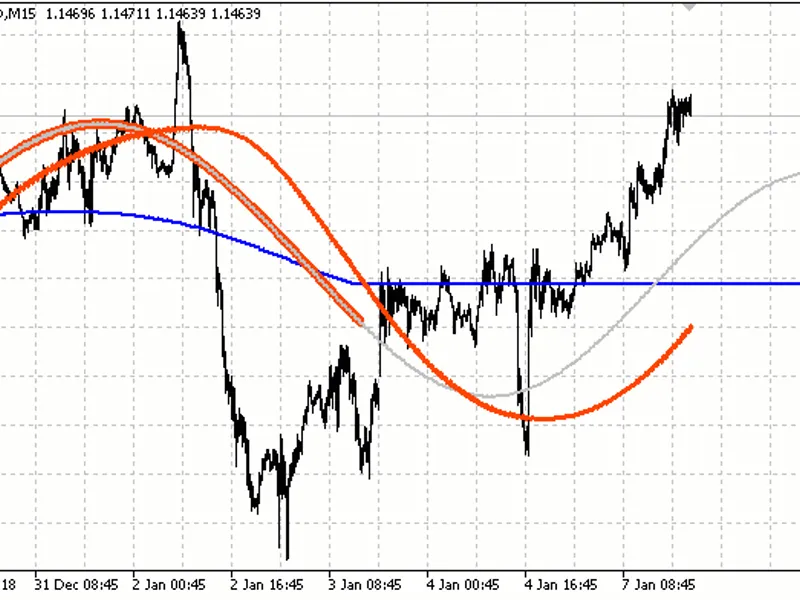
the indicator creates a sliding line based on interpolation by a 4 degree polynomial. the constructed line extrapolates with a sine wave and itsline_poweraxialor nearly constant,or...
inspired by thethe indicator calculates the angle between the trend line and the horizontal. on the x axis - minute bars are taken, regardless of the timeframe, on the y axis - poi...
this is a simple analytical (non-signal, one-time calculated) indicator that allows you to test the hypothesis that price timeseries represent a "random walk", specifically gaussia...
the indicator draws an arbitrary seconds timeframe on the chart.in the settings:number of days-if you set too many days, it may take a long time to calculate.timeframe in seconds.c...
this multi-symbol indicator shows the price changes of symbols from the market watch between two dates defined by vertical lines.this provides a convenient opportunity to evaluate ...
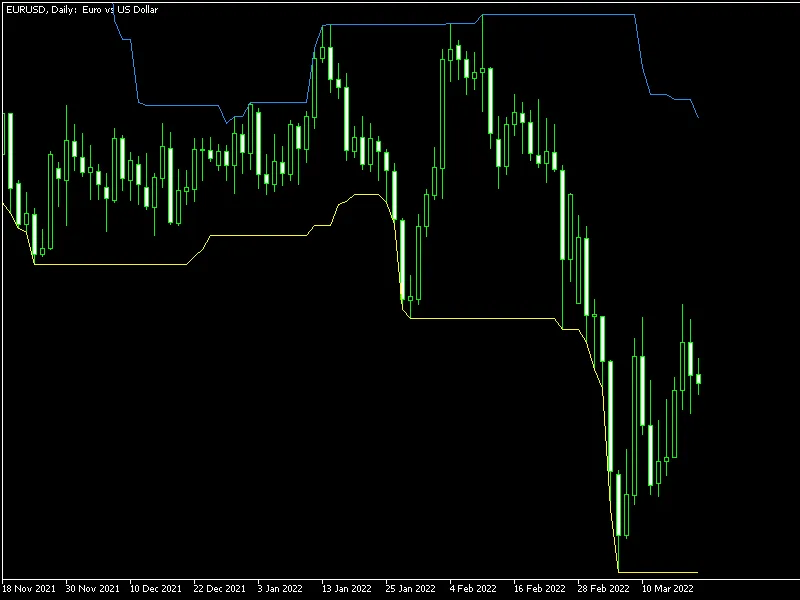
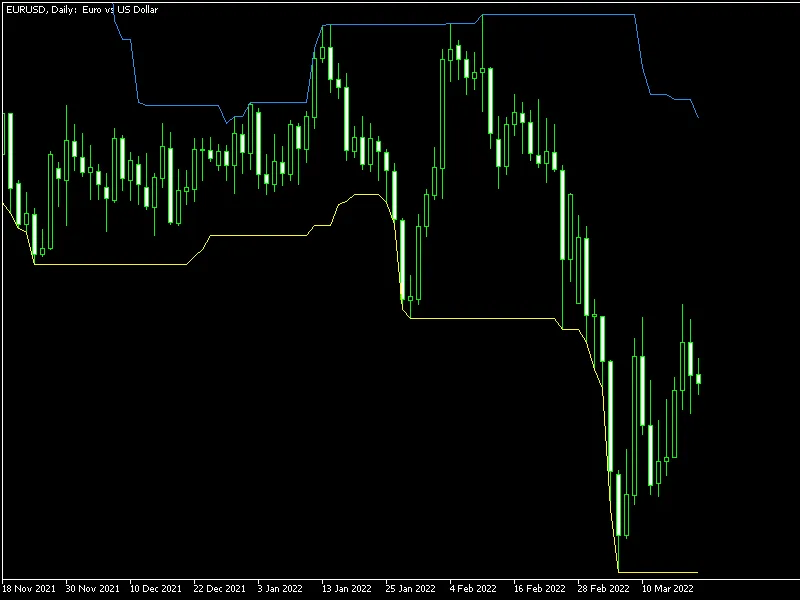
chande kroll stop indicator is an indicator for determining the level of stop loss setting. it represents two lines on the price chart. the red line represents the stop level for a...