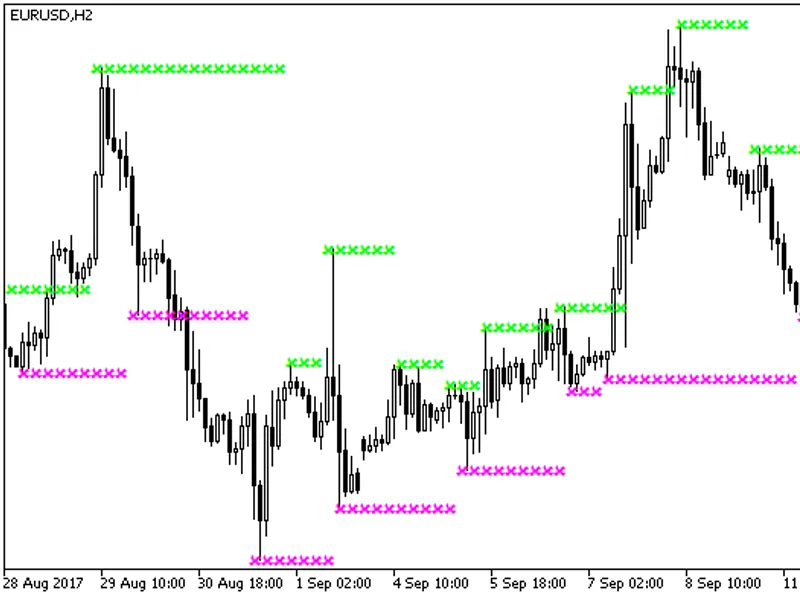
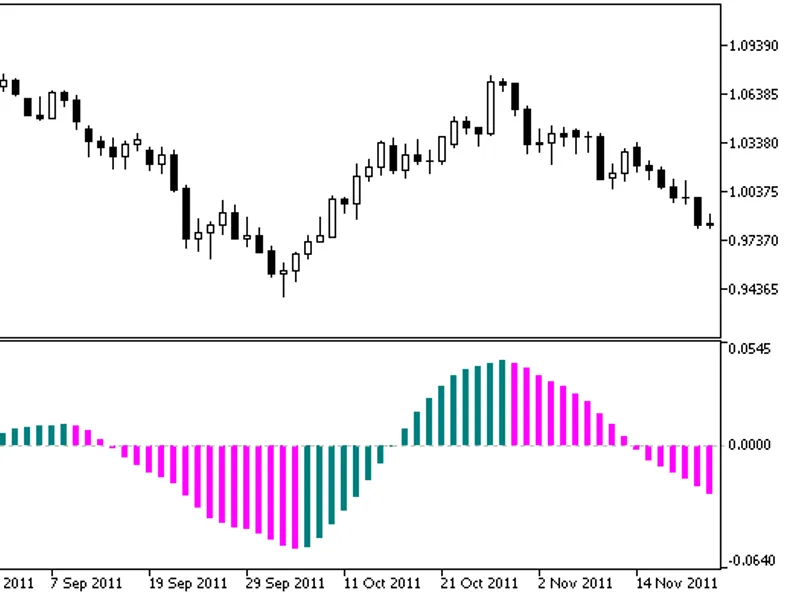
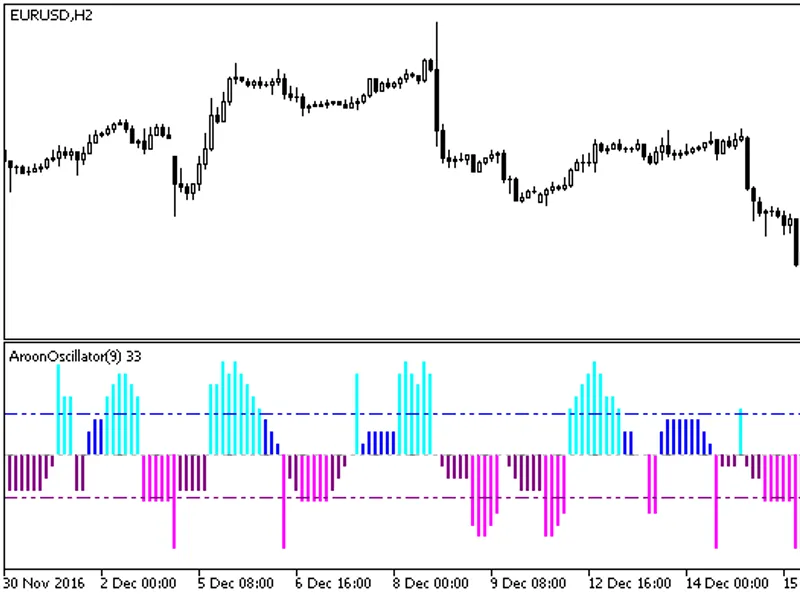
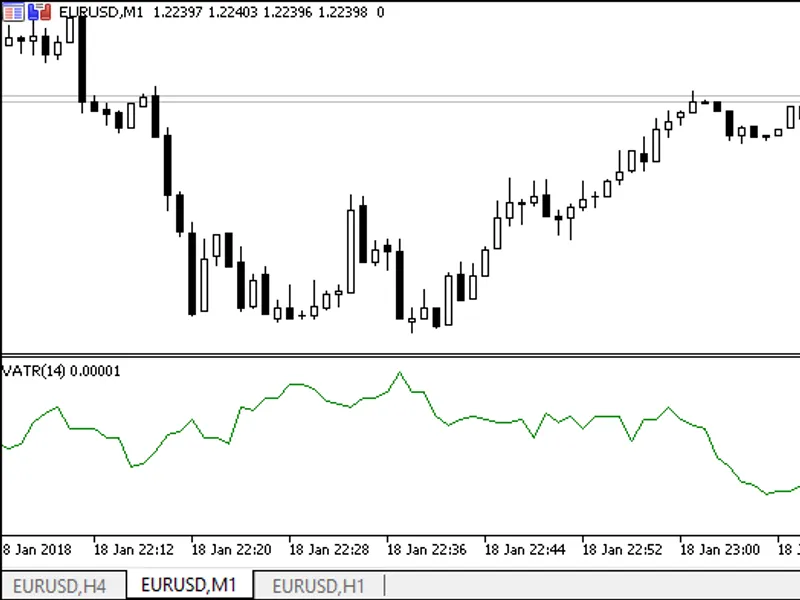
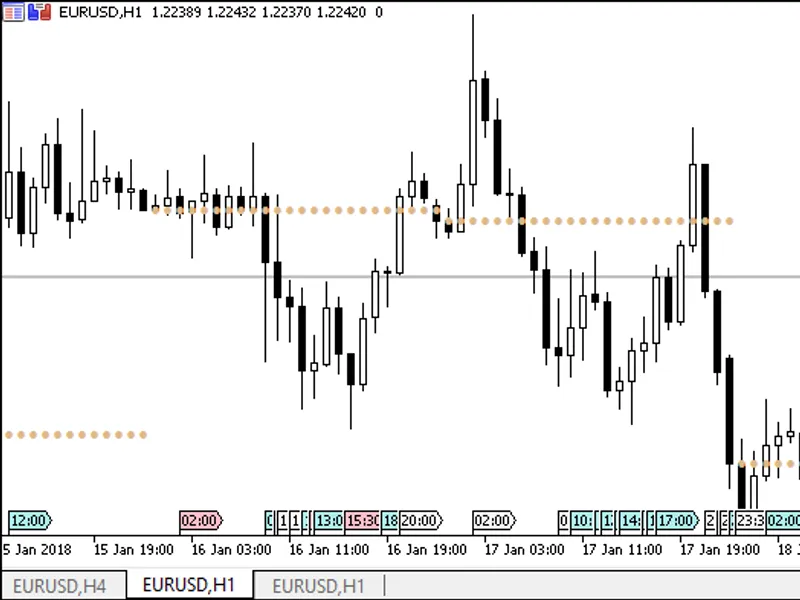
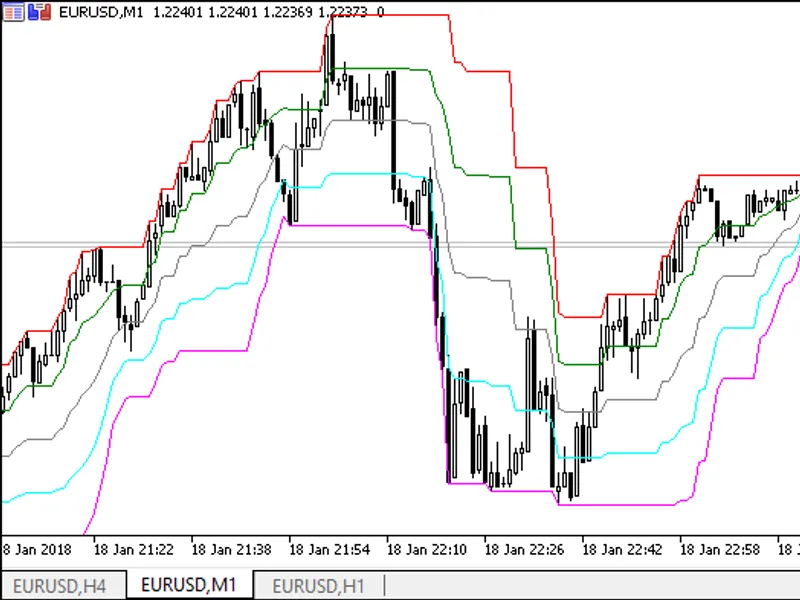
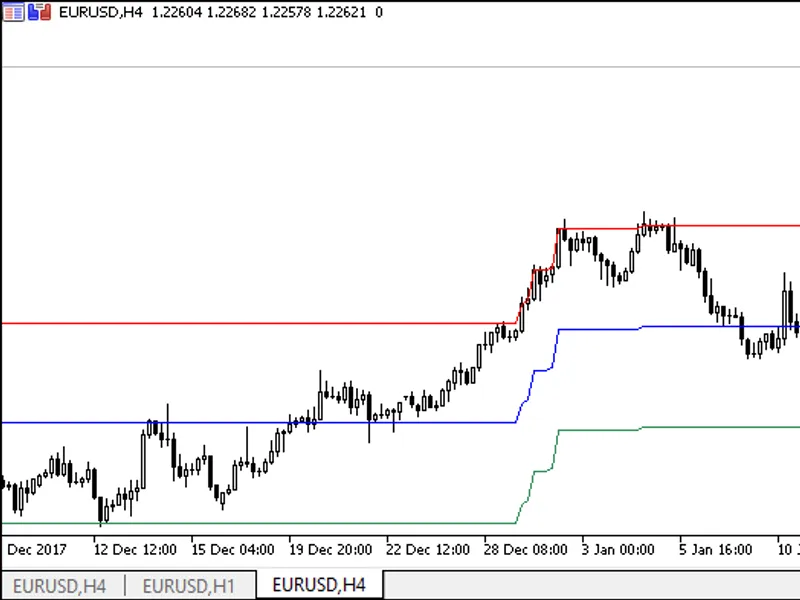
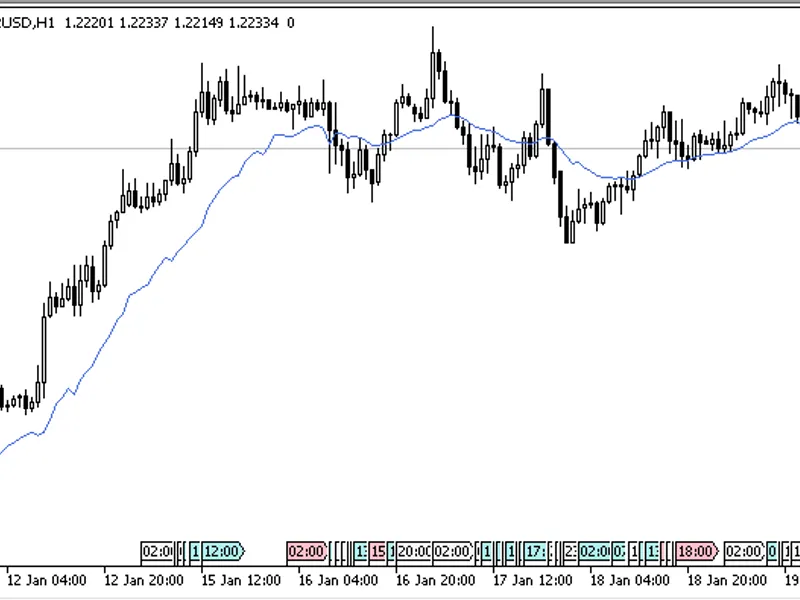
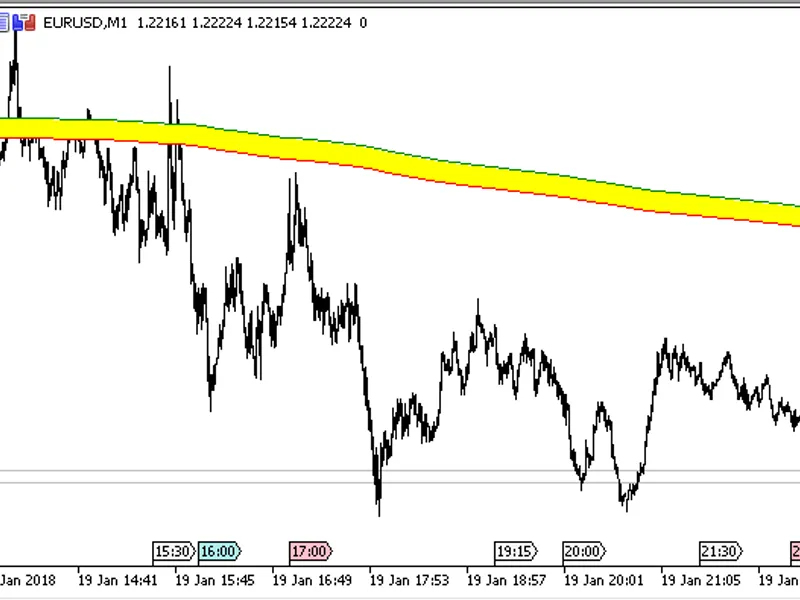
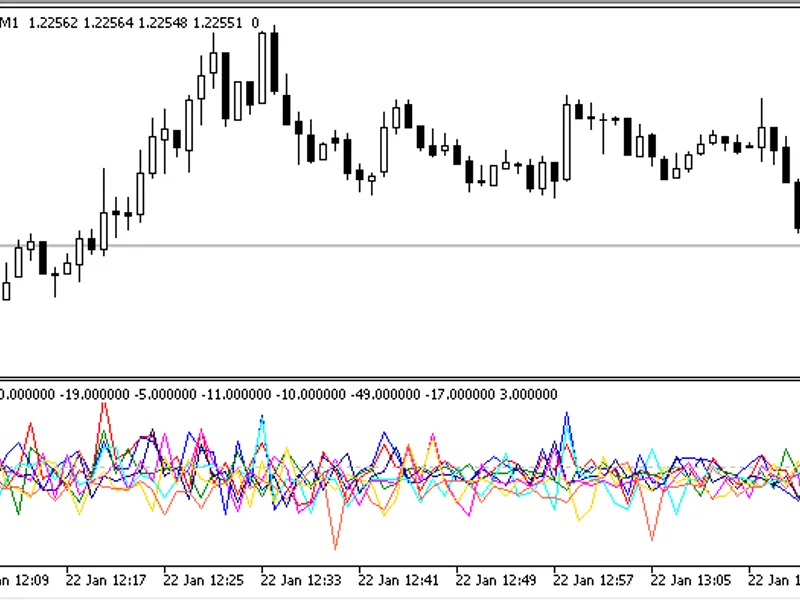
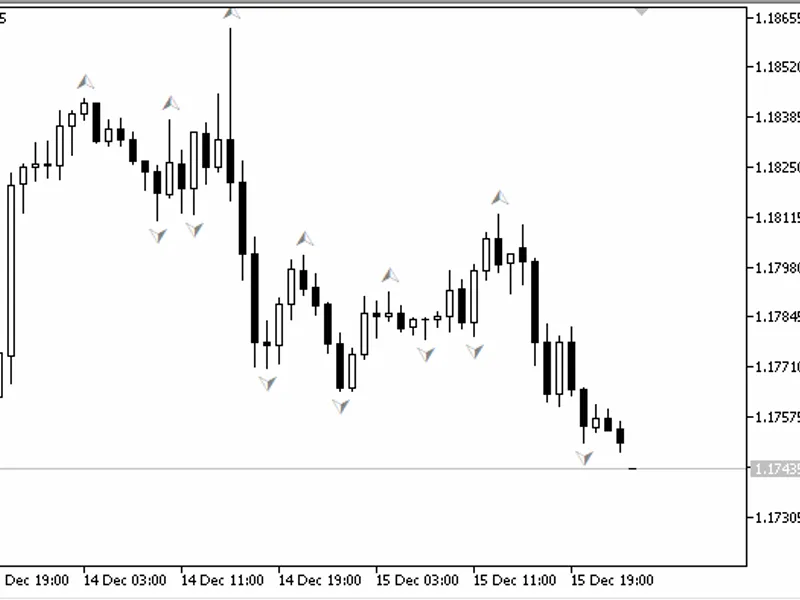
The indicator allows you to change the timeframe in the input parameters.To use this indicator, you need the compiled support_and_resistance.ex5 indicator file. Place this file in ...
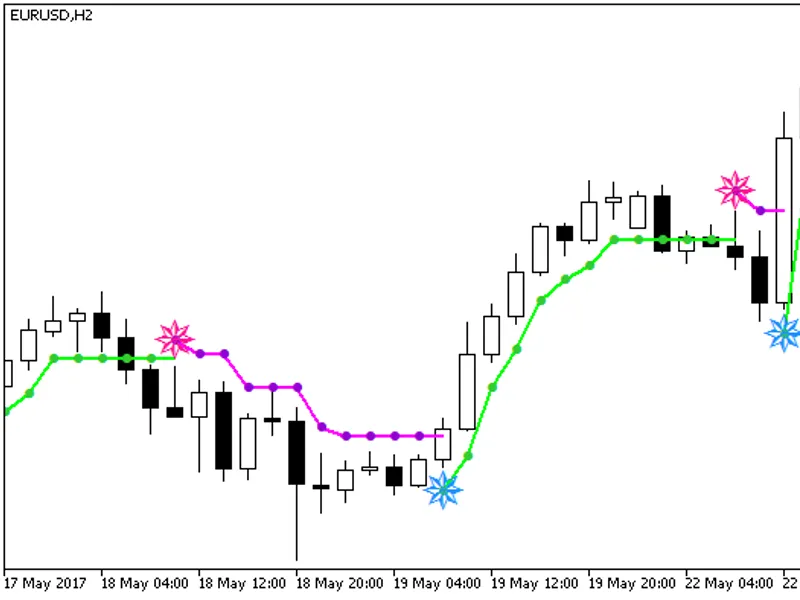
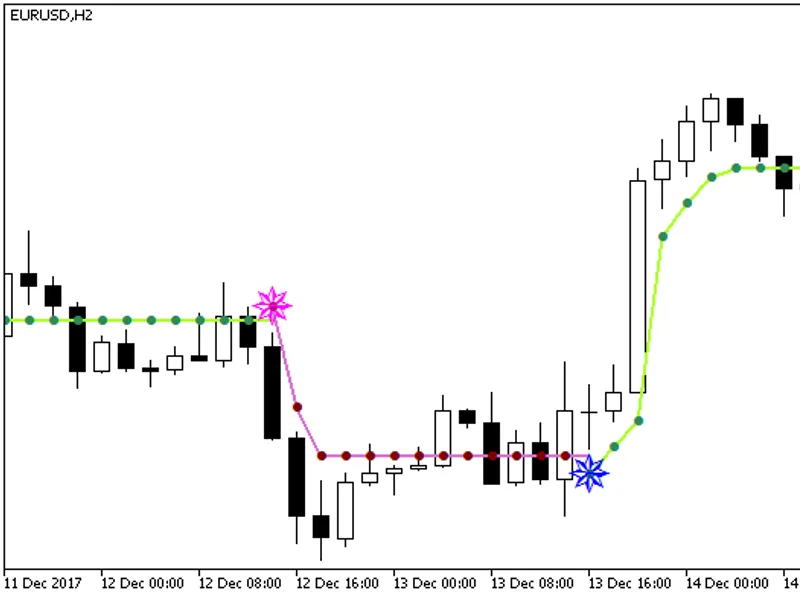
The Bykov Trend NRTR indicator is a powerful tool for traders, combining the Semaphore signal with an NRTR line based on ATR indicator values.Fig. 1: Bykov Trend NRTR Indicator...
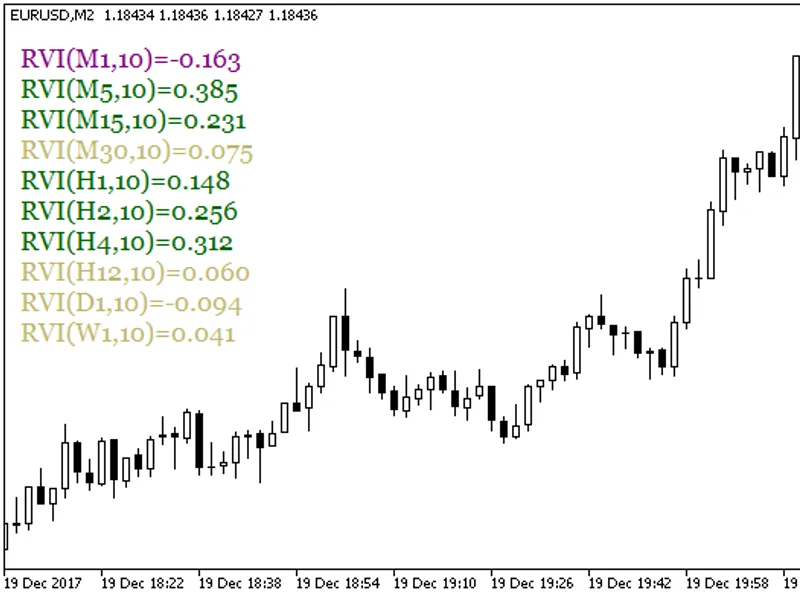
The RV i Values indicator displays a customizable text block with the values of a user-defined oscillator period for various timeframes. Users can adjust the text block size, font,...
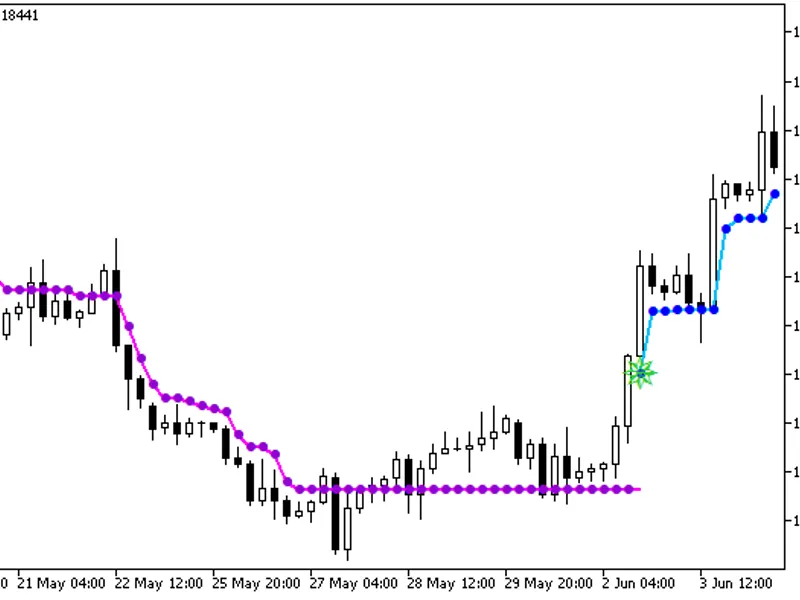
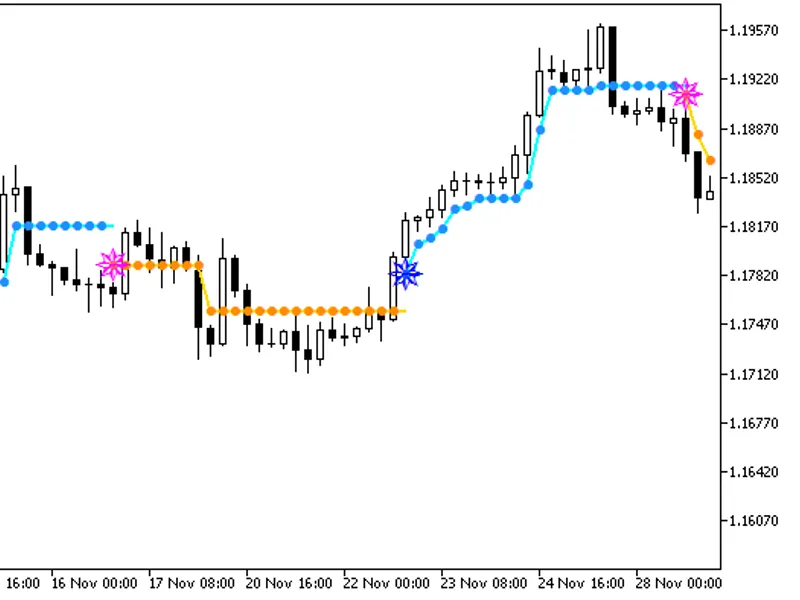
A semaphore signal indicator utilizing the oscillator, akin to an NRTR line derived from the ATR indicator values.This indicator employs the SmoothAlgorithms.mqh library classes (p...
A semaphore signal indicator using the oscillator, similar to NRTR, with a line based on the values of the ATR indicator.The indicator utilizes the SmoothAlgorithms.mqh library cla...
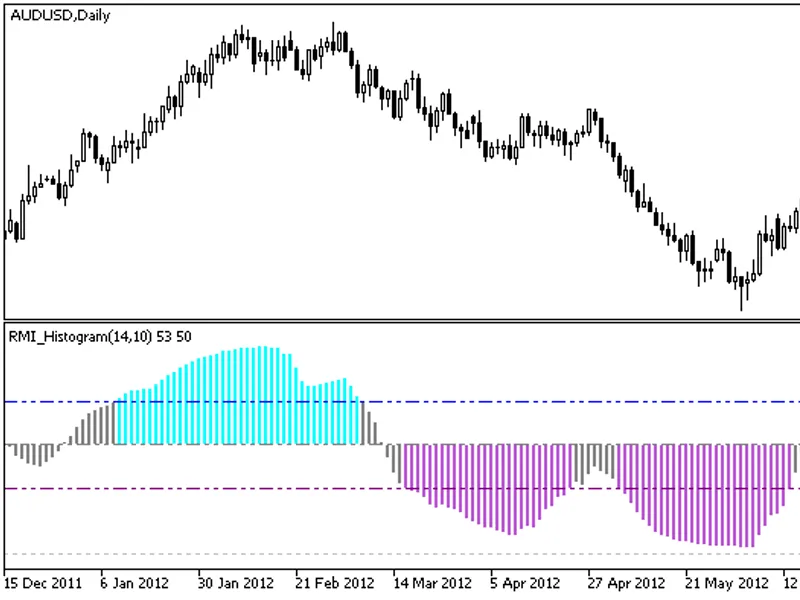
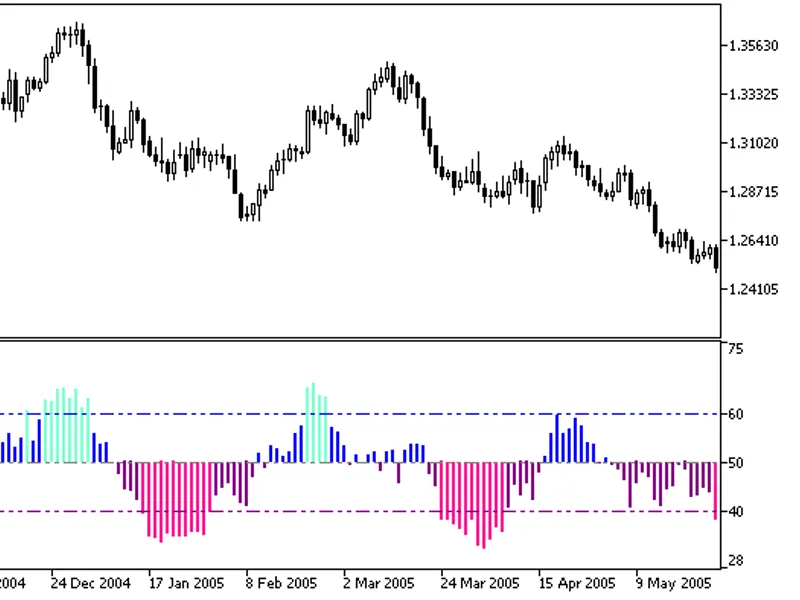
Relative Momentum Index (RMI) implemented as a color histogram with overbought and oversold zone indications.RMI, developed by Roger Altman, was first introduced in 2026 in the 'Te...
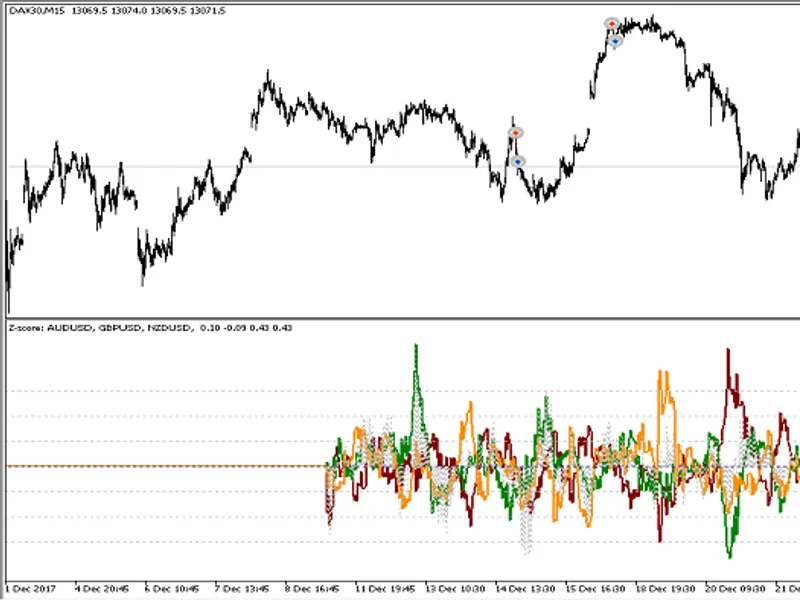
This indicator is a powerful tool for traders using MetaTrader 4/5, offering a unique approach to analyzing multiple symbols and their relationships.It calculates linear regression...
The Smoothed S-ROC indicator calculates the relative price increment using the following formula:S-ROC = (EMA [bar] – EMA[bar - ROC]) / EMA[bar - ROC]where:EMA [bar]is the EMA valu...
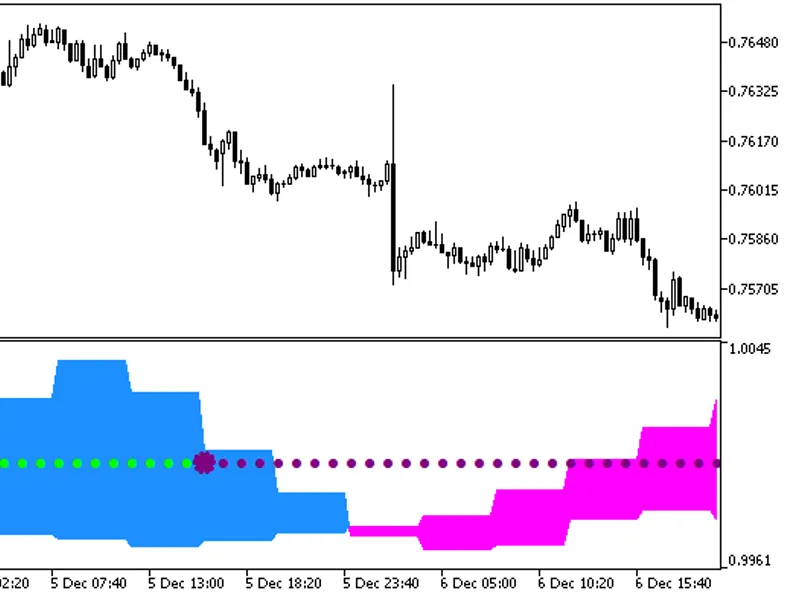
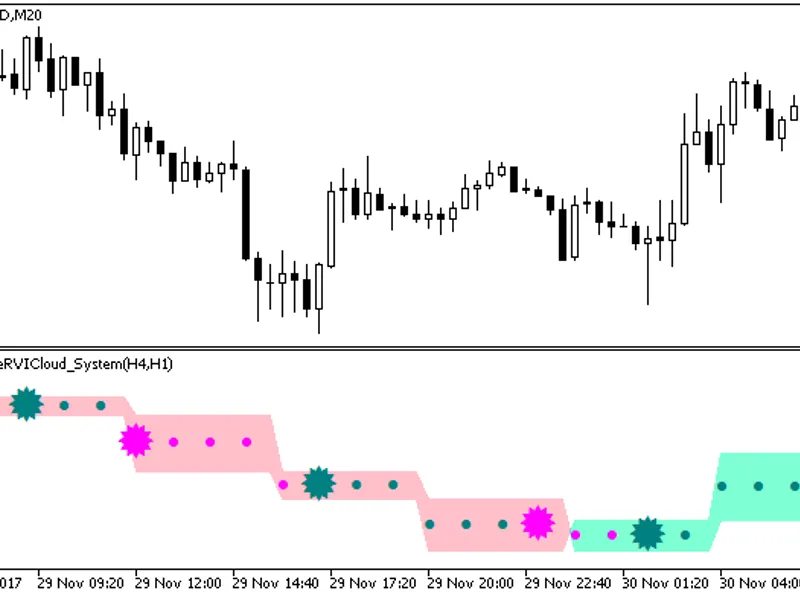
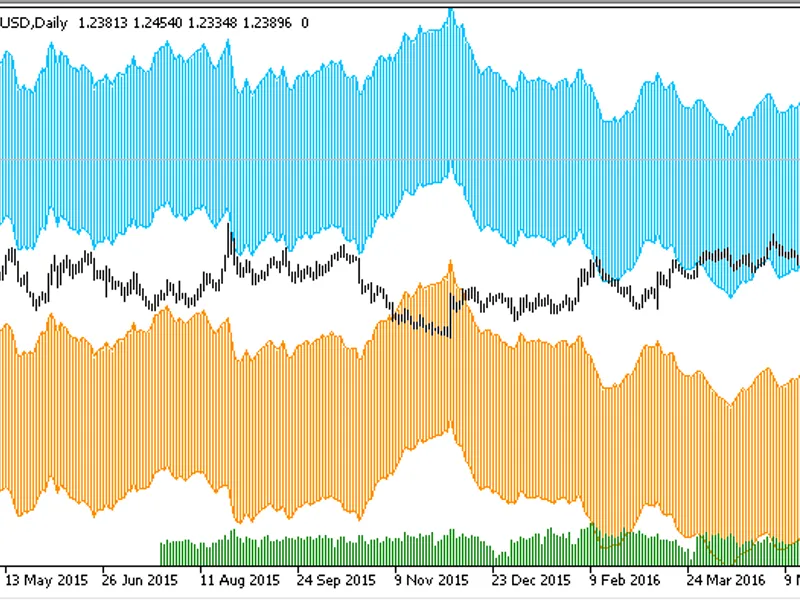
This indicator system offers a unique approach to trend analysis by combining two indicators from different timeframes on a single chart.The larger timeframe indicator is presented...
Display two indicators from different timeframes on one chart.The indicator of a larger timeframe is shown as a color trend cloud, determining the trend. The second indicator of a ...
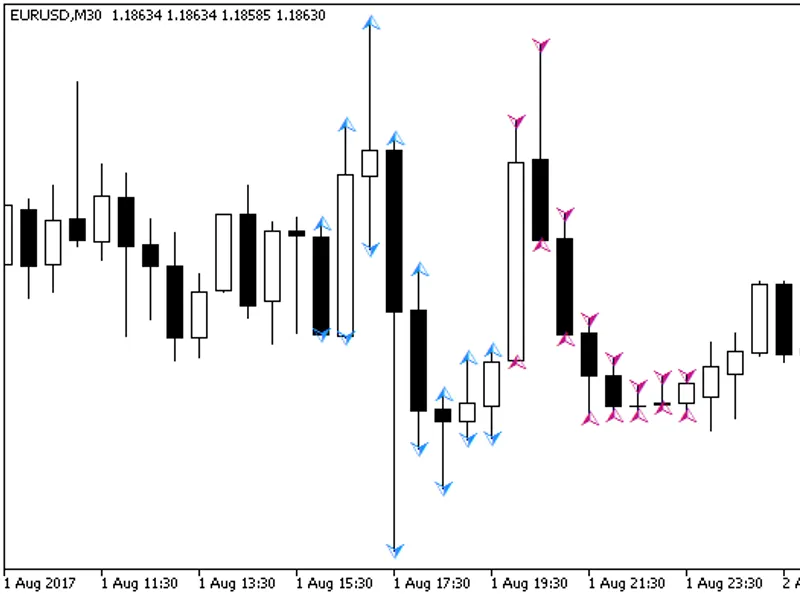
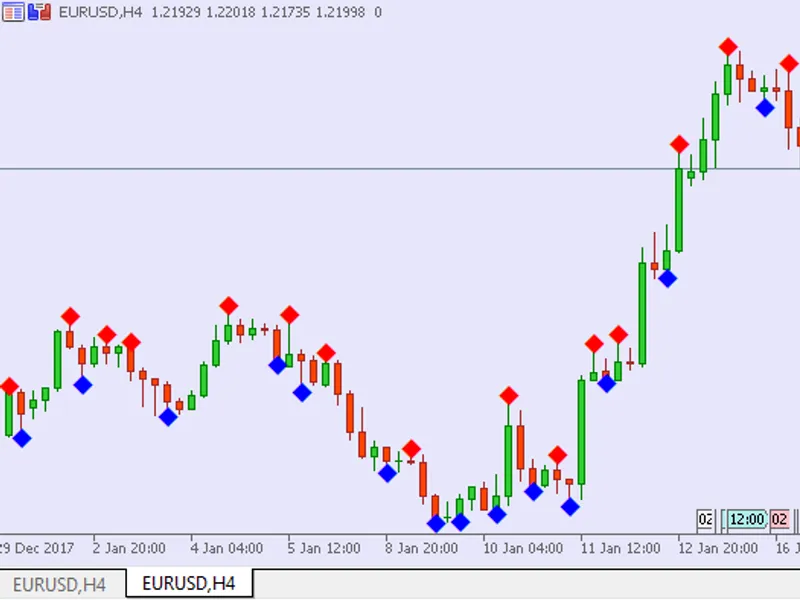
The InOutBar indicator is a powerful tool that visually identifies candlestick patterns by marking them with colored arrows. It compares the current candlestick with the previous o...
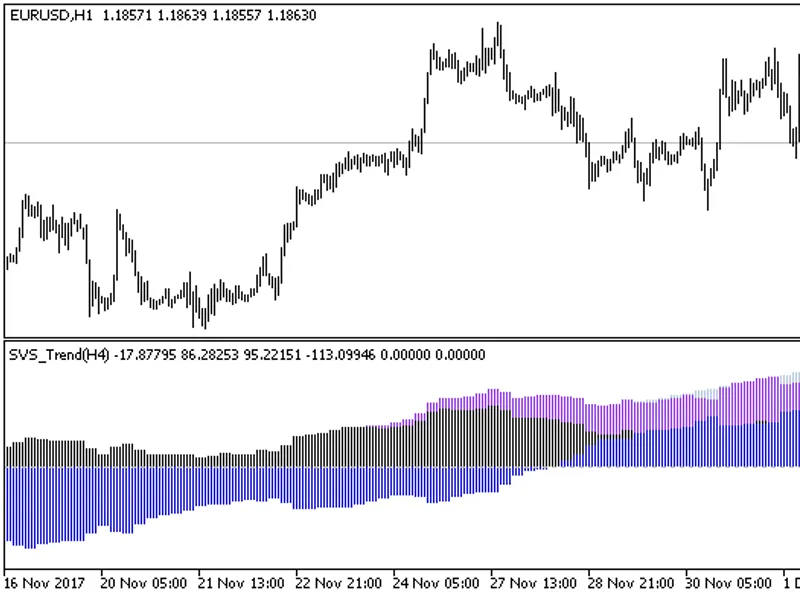
The SVS Trend HTF indicator offers the flexibility to adjust the indicator timeframe within its input parameters.This indicator relies on the compiled svs_trend.ex5 file, which sho...
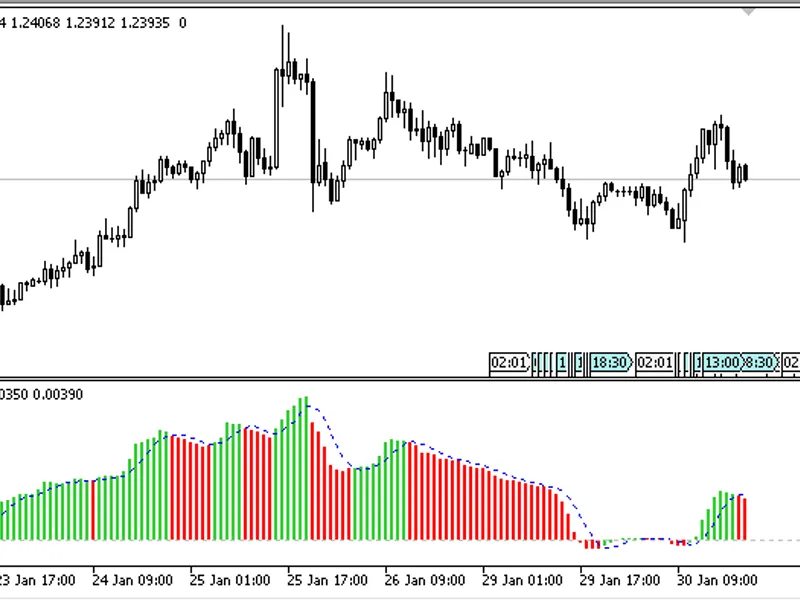
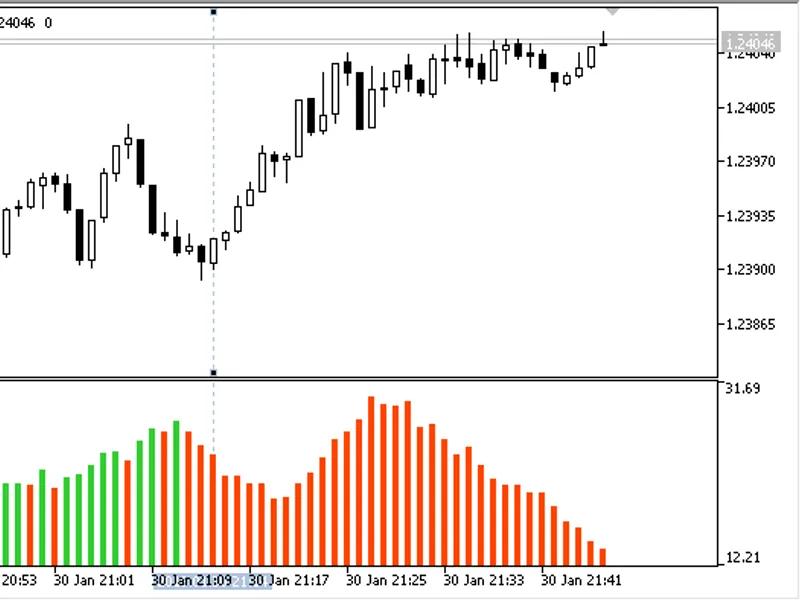
The indicator is presented as a colorful histogram.It utilizes the smoothalgorithms.mqh library classes, which should be copied to \mql5\include. A comprehensive explanation of the...
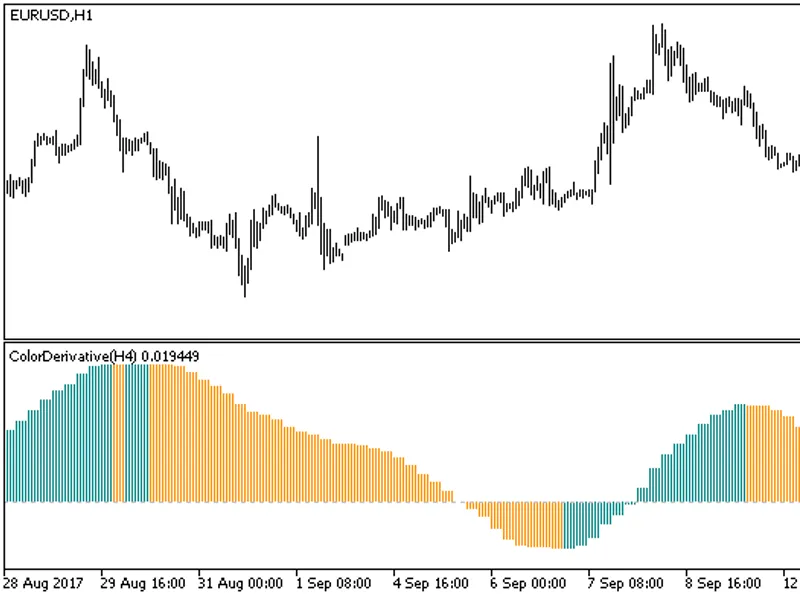
The indicator allows you to modify the indicator timeframe in its input parameters.It requires the compiled colorderivative.ex5 indicator file. Add this file to /mql5/indicators.Fi...
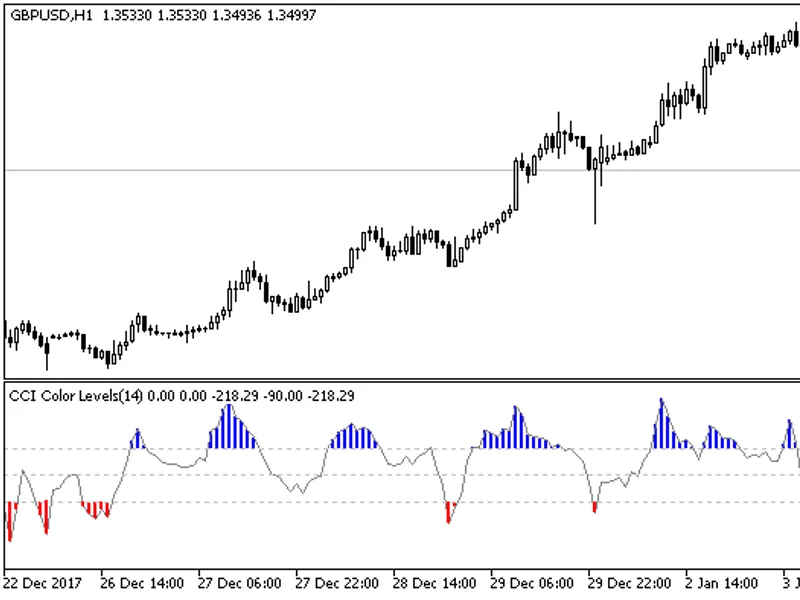
The indicator displays three types of graphical constructions:- Level Up- CCI- Level DownIndicator Input:- Averaging period- Up level value- Down level valueThe up and down levels ...
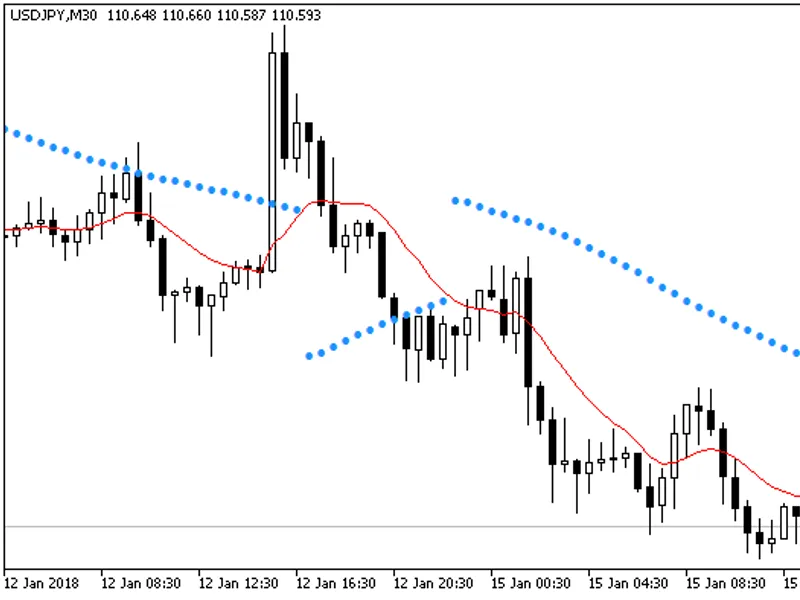
The concept behind this indicator is to utilize the Moving Average (MA) indicator values in place of high and low prices when computing the SAR indicator.The outcome is illustrated...
This indicator identifies fractals of various dimensions: 1x1, 2x2, 3x3, and so on up to nxn.It features a single input parameter:Frames- This specifies the number of bars consider...
This indicator identifies and marks candlesticks that exceed a specified size on the chart. It also offers an alert feature to notify when the current candlestick surpasses the set...
This is a simple oscillator indicator that visualizes the difference between two exponential moving averages (EMAs) as a colored histogram in a separate window.The indicator offers...
This indicator provides a unique way to visualize daily candlesticks with customizable parameters.With this tool, you can:- Set the day beginning hour to define the start of a new ...
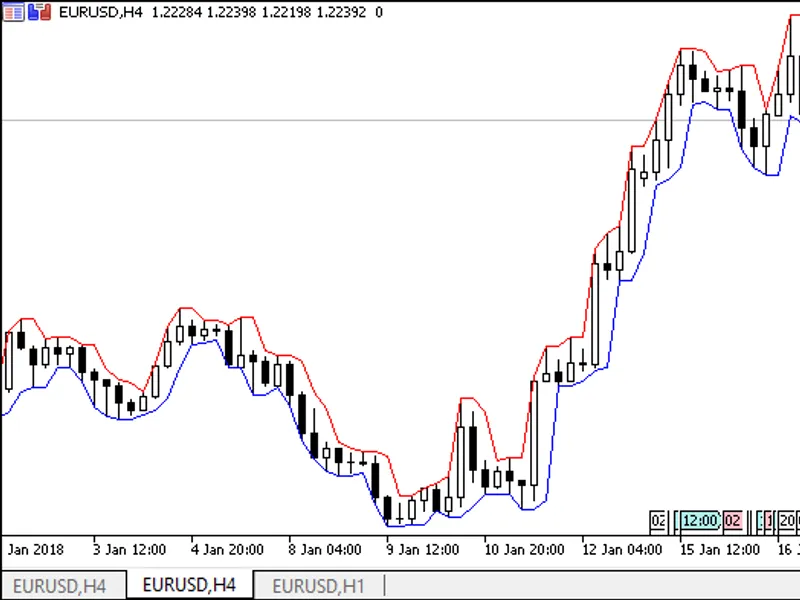
This indicator is designed to display channel borders based on extreme price levels, offering a simple yet effective tool for traders.The indicator features a single adjustable par...
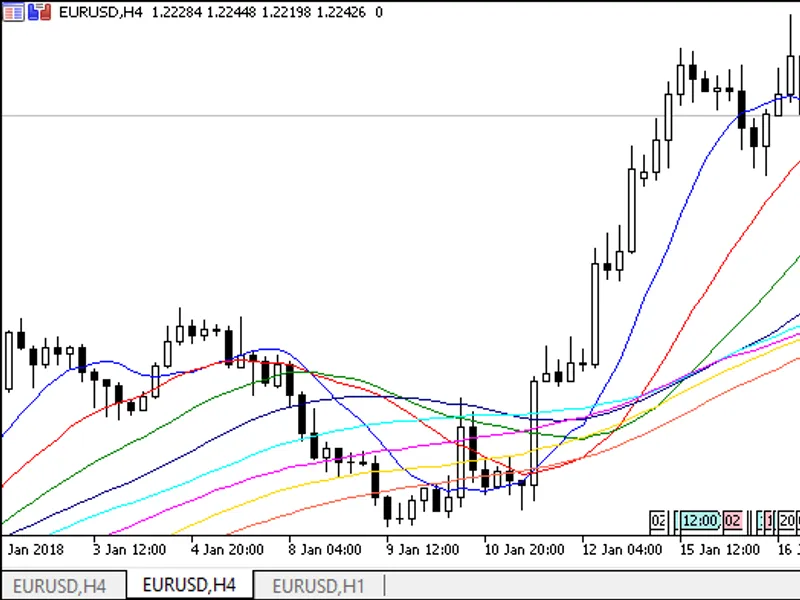
This indicator displays eight moving averages with customizable settings for each.Features:- Set calculation methods and prices for all moving averages simultaneously.- Individual ...
Custom ATR indicator. The indicator values are calculated based on the current day's price range and the difference between the current day's high/low and the previous day's close....
This indicator displays the daily open price on charts with timeframes of H1 or lower. The starting hour of the day can be adjusted in the input parameters.The indicator has a sing...
The Donchian Channel is a versatile indicator with two key parameters:- Period: This parameter defines the calculation period for the indicator.- Mode of Calculation: The indicator...
This indicator creates a channel based on a selected price type, updating the channel levels when the price moves beyond a specified percentage threshold from the previous day's va...
VOLMA is a unique indicator that displays a moving average with a dynamic period based on RSI calculations from tick volume data.This indicator offers a versatile approach to analy...
This indicator calculates a dynamic channel for each bar within a trading day. You can specify the start time of the trading day by setting the hour and minute.Input Parameters:- H...
This indicator displays the momentum of multiple symbols on a single chart, aiding in trend analysis and trading decisions.The calculation is based on a moving average (MA) with cu...
The "Fractals at Close Prices" indicator is a unique tool that utilizes only close prices in its calculations. This indicator is designed to provide valuable insights for traders a...
The VR Alert MT5 indicator is a powerful tool designed to notify traders when the price reaches a specific level.This indicator is an invaluable assistant for traders who anticipat...
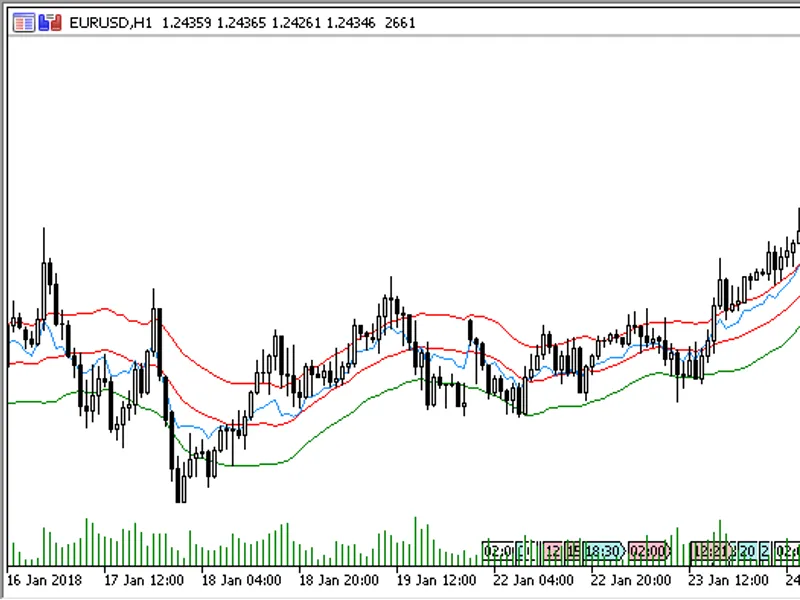
This indicator provides a customizable Keltner Channel, offering a versatile tool for technical analysis.Key Features:- **Central Line Customization**: - Choose from three smoothi...
This indicator provides a customizable Keltner Channel, a volatility-based technical analysis tool.Features:- Set any price and calculation method for the central line.- Channel li...
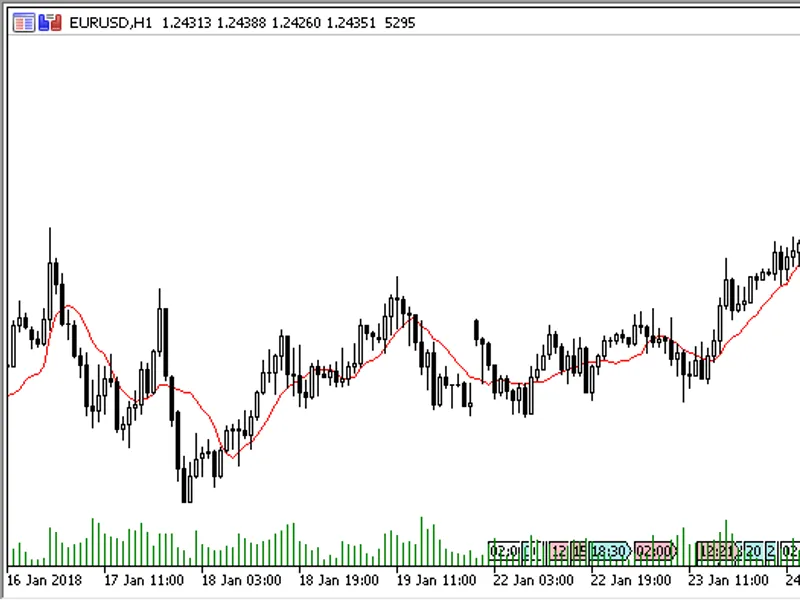
The indicator displays two simple moving averages from two timeframes on a single chart: the current timeframe and the timeframe specified in the input parameters.It has two custom...
The indicator draws a Volume Adjusted Moving Average (VAMA), a variation of the Simple Moving Average (SMA) that incorporates tick volumes for each bar.Parameters:- Period VAMA: Th...
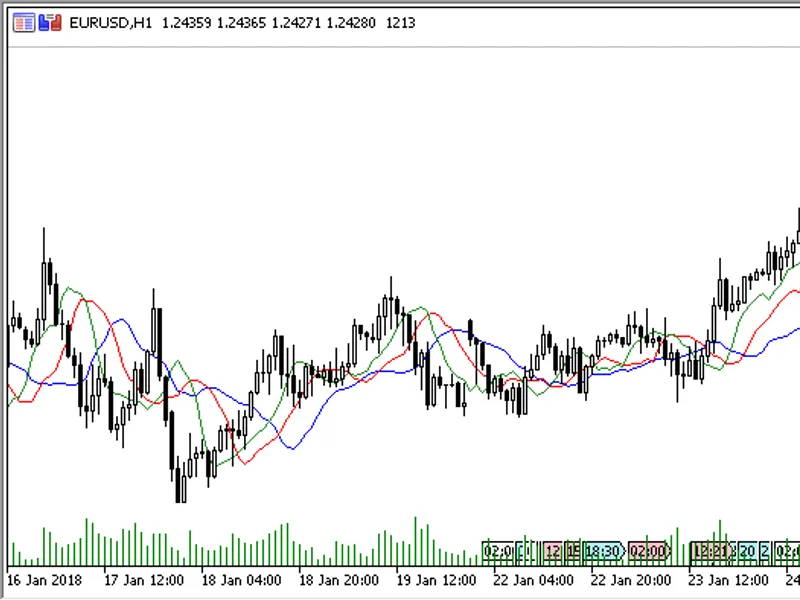
The Alligator Indicator is a powerful tool for traders, based on the VAMA indicator.This indicator offers seven customizable parameters to tailor it to your trading strategy:- Peri...
The indicator displays the standard RSI on the price chart, along with its overbought/oversold levels and a moving average indicator line.Key features include:- RSI calculation per...
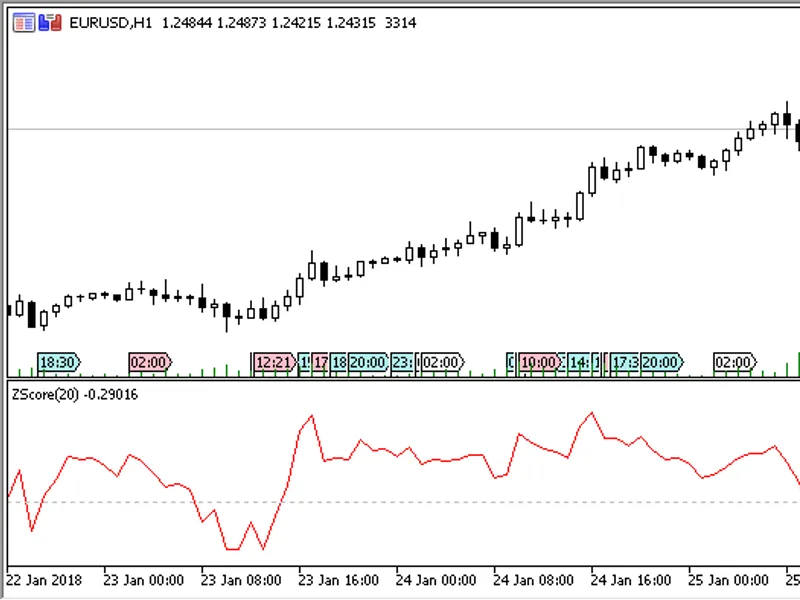
The ZScore indicator calculates the standard score (z-score) of a price series, representing the number of standard deviations from its mean.This indicator provides insights into p...
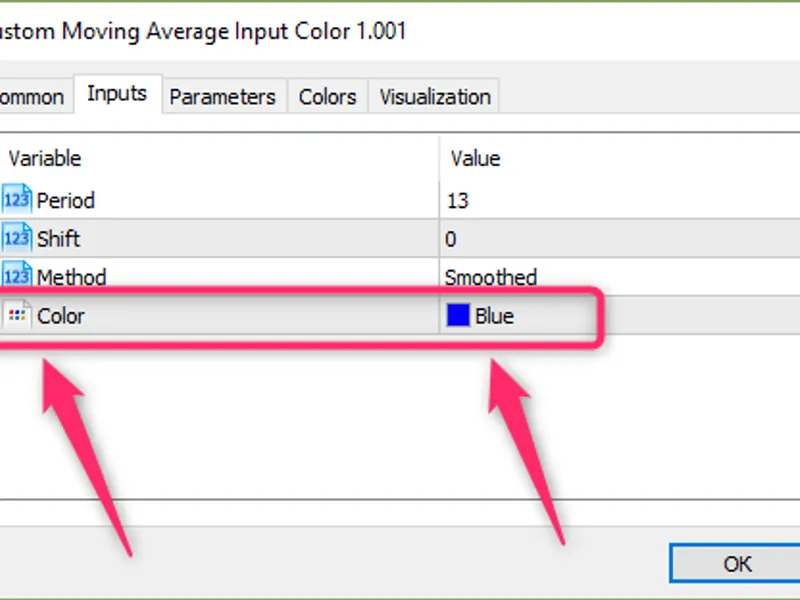
The 'line color' parameter has been introduced as a new input setting.Previously, when an Expert Advisor utilized the Moving Average indicator data, the indicator would only appear...
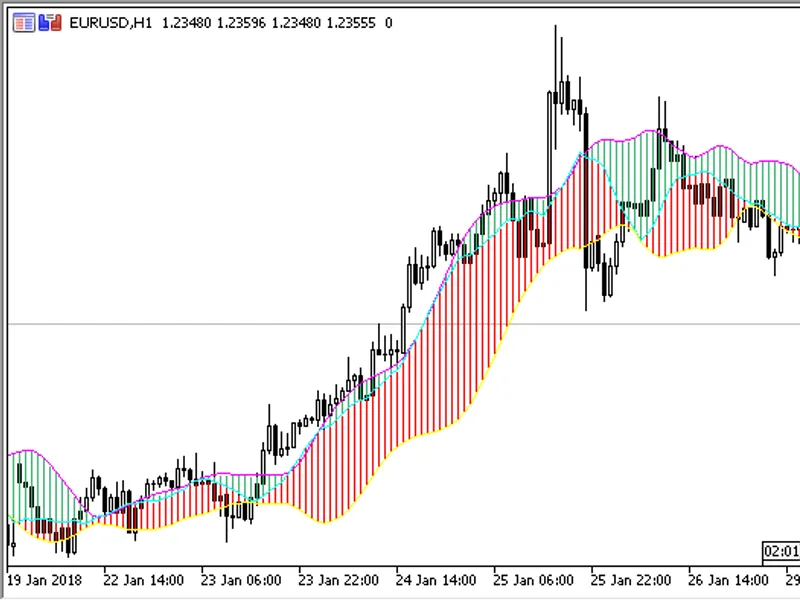
This indicator provides a comprehensive view of market trends by combining a moving average with bullish and bearish areas derived from Bollinger Bands.Key features include:- Movin...
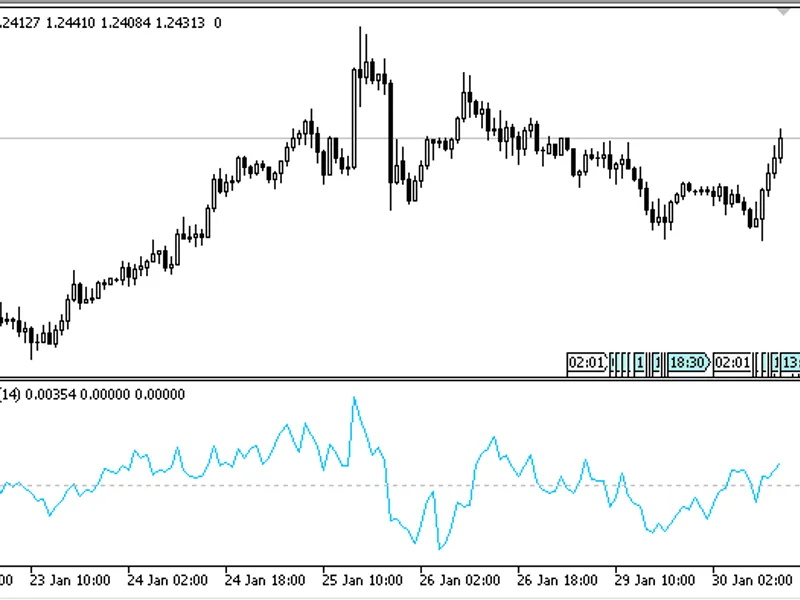
The Trend Pressure Indicator is a powerful tool for traders, providing valuable insights into market trends. It offers a comprehensive view of the market's direction and strength, ...
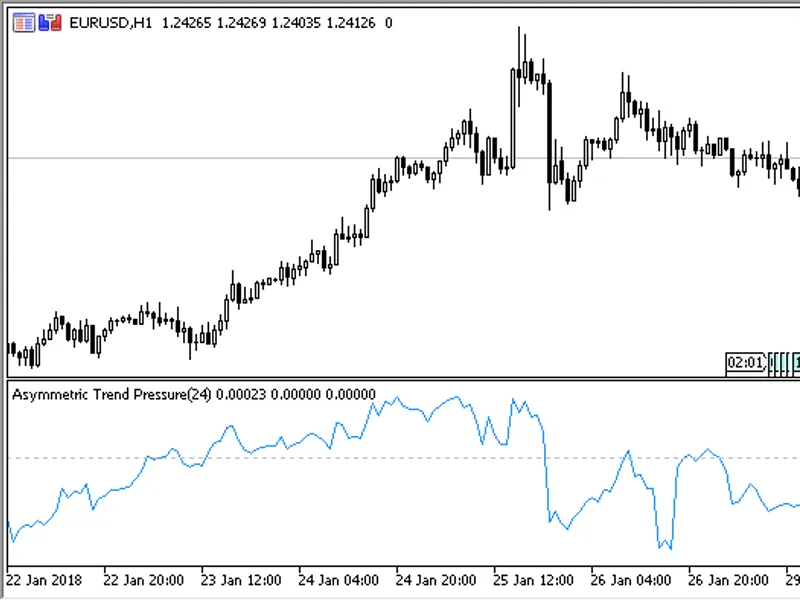
The Asymmetric Trend Pressure Indicator is a powerful tool that reveals the trend direction and strength. It provides a comprehensive view by displaying the bullish and bearish com...
This indicator displays the Moving Average Convergence Divergence (MACD) calculated based on the Adaptive Moving Average (AMA).The indicator offers eight customizable parameters:- ...
The Wilson Relative Price Channel is an indicator based on the classic RSI, displaying three distinct zones: overbought, oversold, and neutral. It is designed for higher timeframes...
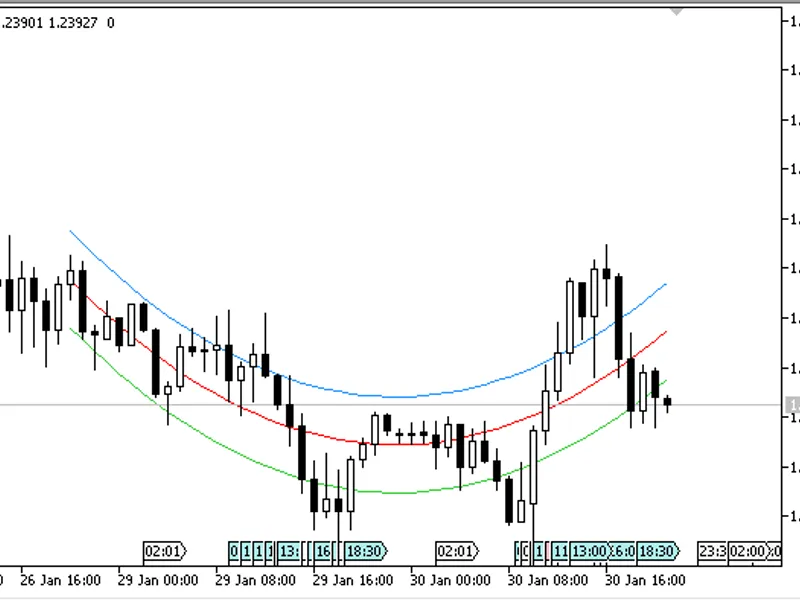
This indicator draws a channel based on the polynomial regression method.It offers four customizable parameters:Length- Determines the channel's length in bars.Power- Adjusts the s...
The Difference Indicator displays the disparity between current prices and prices from n periods prior.It offers two display modes:- Difference between open and close prices.- Diff...